
Figure 1.
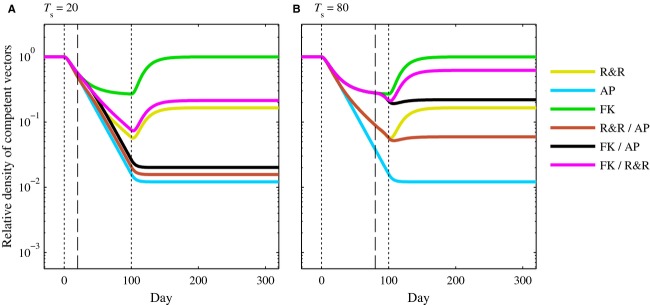
Relative density of competent vectors when male-only releases were conducted at a 1:1 release ratio (r = 1) for T = 100 days. Vertical black dotted lines represent the time at which releases began (t = 0) and ended (t = 100). For combination strategies, the vertical black dashed line represents the time at which a switch was made between approaches. Here, the time of switch was Ts = 20 (A) and Ts = 80 (B). All other parameter values are the default values listed in Table 2. Note the vertical axis is on a log scale.