
Figure 5.
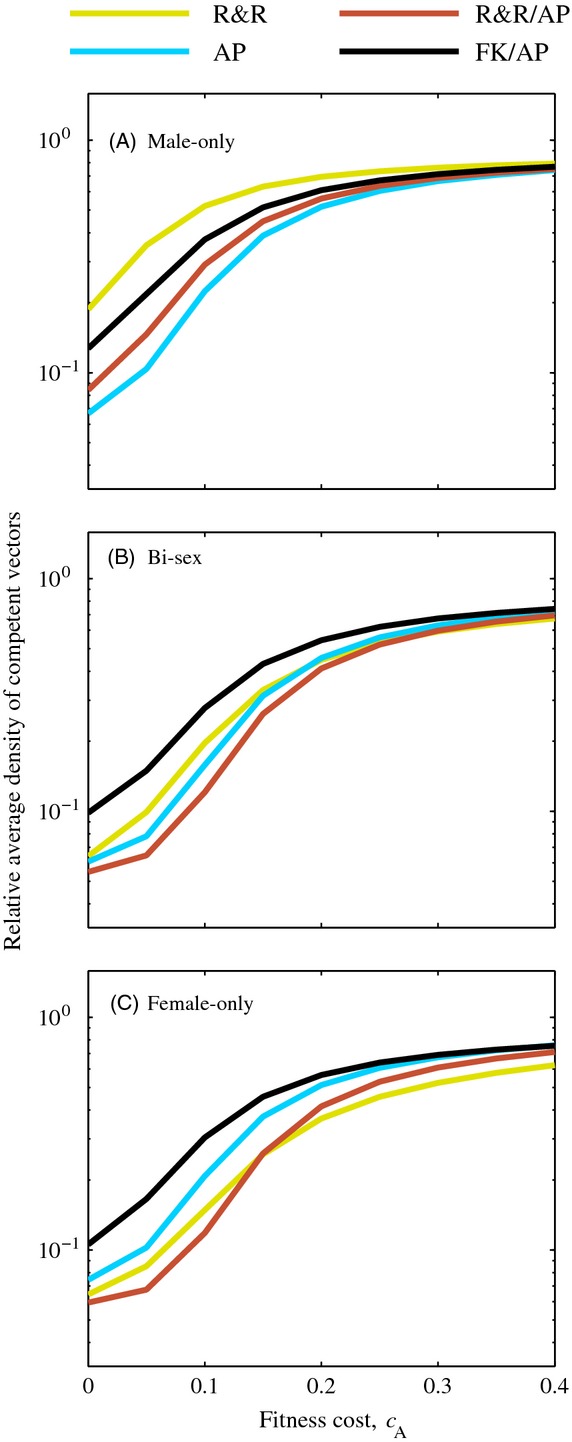
Relative average density of competent vectors between the time releases began (t0 = 0) and one year after the final day of releases (tf = 465) when the antipathogen gene carried a fitness cost. Releases were conducted at a 1:1 (r = 1) release ratio for T = 100 days with male-only (A), bi-sex (B), and female-only (C) releases. For combination strategies, the switch between approaches occurred after Ts = 50 days. All other parameter values are the default values listed in Table 2. Note the vertical axis is on a log scale.