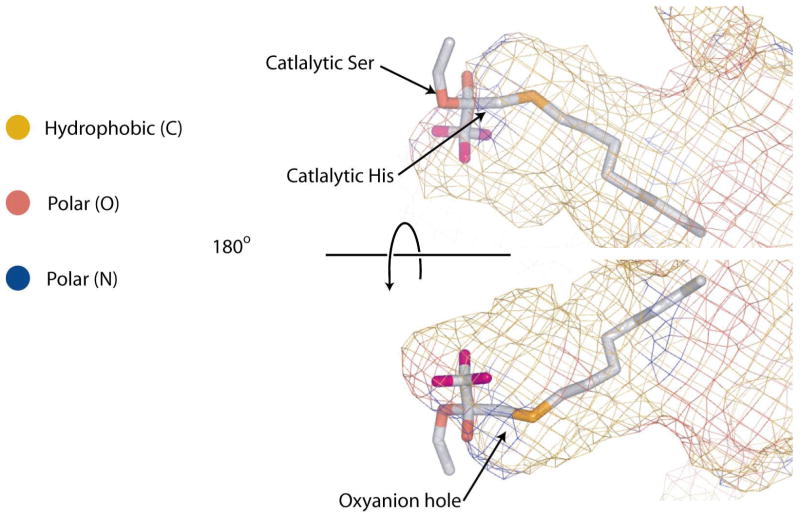
Figure 4.
Surface representation of the active site tunnel. The surface is shown in a mesh representation and is color coded by the type of atoms that contribute to making the surface, with carbon atoms in gold, oxygen in red and nitrogen in blue. The bottom panel is a 180° rotation of the top panel about the y-axis.

