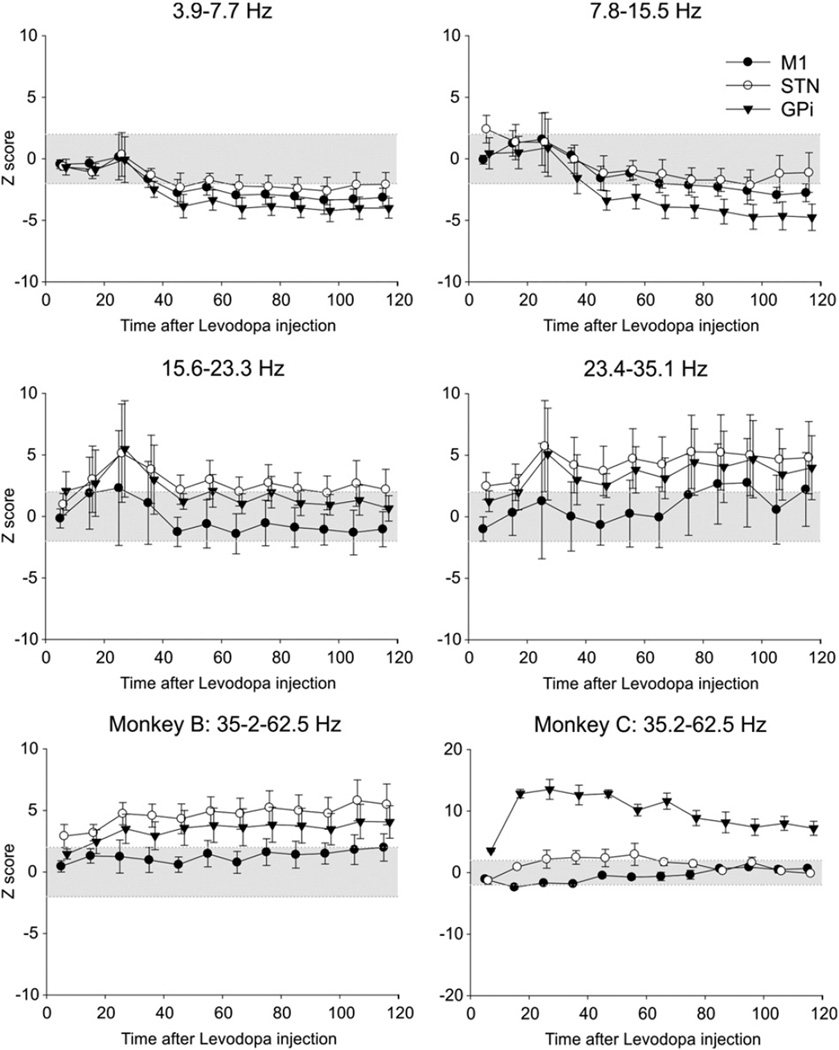
Fig. 8.
Summary of levodopa-induced changes in spectral power inM1 EEG, and STN– and GPi–LFPs. Injections were given at time 0 and changes (calculated for 10 min increments) are expressed as Z-score values, compared to the respective baselines. The figure shows data from monkey B in all but the last subplot. Changes were similar between monkeys, except for the 35.2–62.5 Hz range which is shown separately for monkeys B and C. Shown are results of an analysis of M1 EEG signals (filled circles, mean ± SEM), as well as LFPs from the STN (open circles) and GPi (triangles). The area marked in gray corresponds to Z-score values of ±2.

