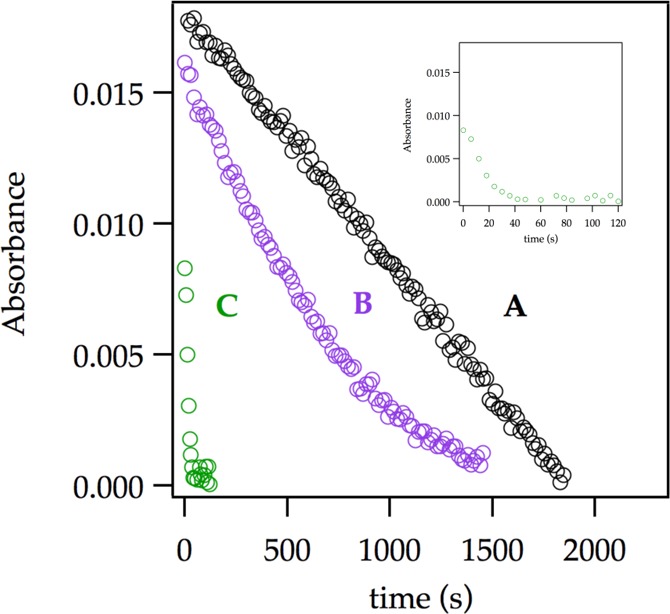
Figure 13.

Representative plot showing the absorbance of ArH versus time for the ortholithiation of ArH (0.0050 M) with LDA (0.10 M) in THF (12.2 M) at −78 °C (curve A). Curve B shows the decay under the same conditions as in A but with 0.020 M ArLi. After the lithiation was complete, 0.0010 M LiCl was added and a second aliquot was injected into this mixture (curve C; see inset for expansion). Reactions were monitored with IR spectroscopy.
