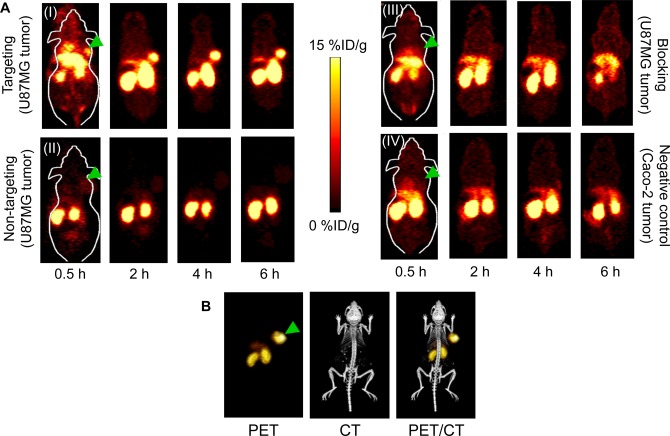
Figure 3.
Serial PET imaging of EGFR expression. (A) Serial coronal PET images at 0.5, 2, 4, and 6 h p.i. of (I) 44Sc–CHX-A″-DTPA–Cetuximab-Fab in U87MG tumor-bearing mice (targeted), (II) 44Sc–CHX-A″-DTPA-denatured-Cetuximab-Fab in U87MG tumor-bearing mice (non-targeted), (III)44Sc–CHX-A″-DTPA–Cetuximab-Fab after treatment with a 2 mg blocking dose of Cetuximab before injection in U87MG tumor-bearing mice, and (IV) 44Sc–CHX-A″-DTPA–Cetuximab-Fab in Caco-2 tumor-bearing mice (negative control). (B) Representative PET/CT images of U87MG tumor-bearing mouse at 4 h p.i. of 44Sc–CHX-A″-DTPA–Cetuximab-Fab. Arrowheads indicate tumors.

