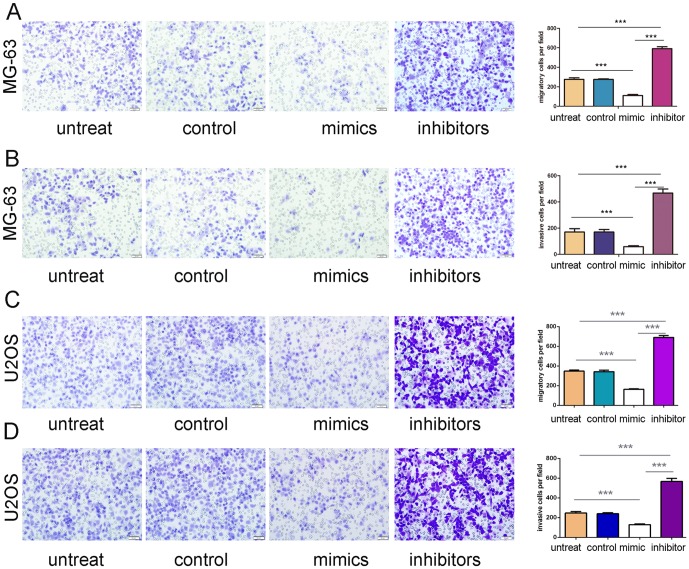
Figure 3. Overexpression of miR-503inhibitedmigration and invasion of osteosarcoma cells.
(A) Migration assays of the MG-63cells after treatment with miRNA mimics, inhibitors or scramble or no transfection; the relative ratio of migratory cells per field is shown on the right. (B) Invasion analysis of the MG-63 cells after treatment withmiRNA mimics, inhibitors or scramble or no transfection; the relative ratio of invasive cells per field is shownon the right. (C) Migration assays of the U2OScells after treatment with miRNA mimics, inhibitors or scramble or no transfection; the relative ratio of migratory cells per field is shown on the right. (D) Invasion analysis of the U2OScells after treatment withmiRNA mimics, inhibitors or scramble or no transfection; the relative ratio of invasive cells per field is shownon the right, *p<0.05, ** p<0.01, and ***p<0.001.

