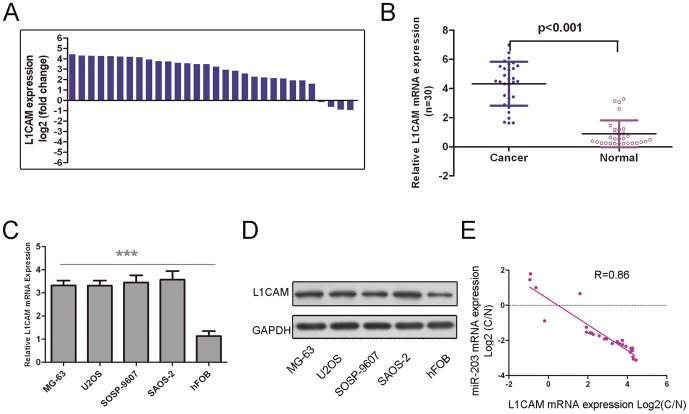
Figure 5. L1CAM was inversely expressed with miR-503 in osteosarcoma (A) qRT-PCR analysis of L1CAM expression in 30 pair's osteosarcoma tissues and their corresponding adjacent normal tissues.
The expression of L1CAM was normalized to GAPDH. (B) Relative L1CAMexpressionlevels inosteosarcoma tissues and their corresponding adjacent normal tissues.(C) The L1CAM relative mRNA expression levels were determined by qRT-PCR in Human osteosarcoma cell lines (MG-63, U2OS, SOSP-9607, and SAOS-2)) and hFOB. (D) Western blot analysis ofL1CAM expression in Human osteosarcoma cell lines (MG-63, U2OS, SOSP-9607, and SAOS-2)and hFOB. (D) Analysis of correlation of miR-503 and L1CAM expression in osteosarcoma tissues. (Two-tailed Pearson's correlation analysis, r = −0.86; p<0.01, n = 30). Data was presented as log 2 of fold change of osteosarcoma tissues relative to non-tumor adjacent tissues.***p<0.001.

