
Figure 1.
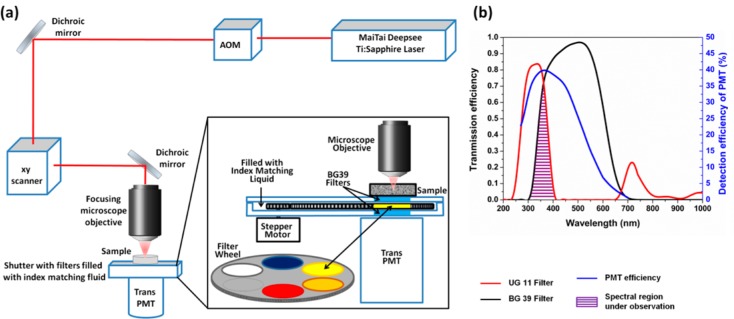
Schematic representation of the DIVER microscope setup.25,26 (a) The upright excitation scheme and positioning of sample directly on top of wide area PMT. The inset shows the construction of the filter wheel assembly. (b) Overlap of the transmission spectra of the filters used, UG11 (red line) and BG39 (black line), and the detection efficiency of the PMT (blue line). The overlapped wavelength area (purple) is used for detection of tryptophan fluorescence.