
Figure 4.
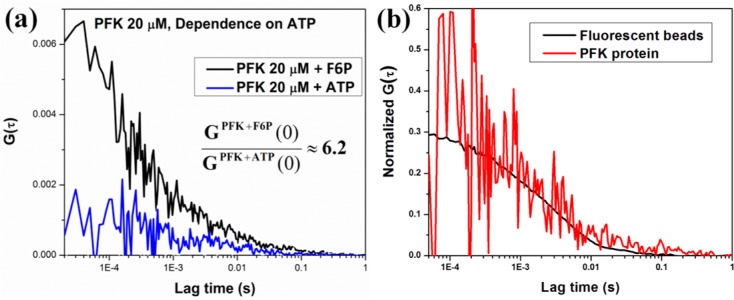
(a) Single point FCS decays of the phosphofructokinase (PFK) in the presence of fructose 6 phosphate (F6P) (black) and in the presence of ATP (blue). (b) Overlap of normalized autocorrelation functions of PFK (red), 100 nm polystyrene beads (black).