
Figure 2. SNP rs3128965 of HLA-DPB1 as a target SNP for susceptibility to AERD.
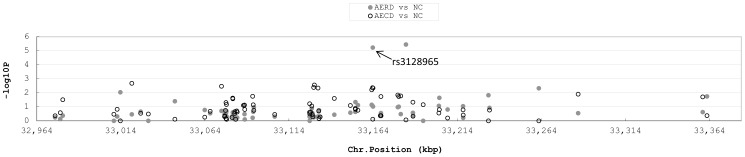
Negative logarithm P values are shown around the HLA-DPB1 region. Closed circles indicate the P value of each SNP in a comparison of AERD and NC. Open circles indicate the P value of each SNP in a comparison of AECD and NC.