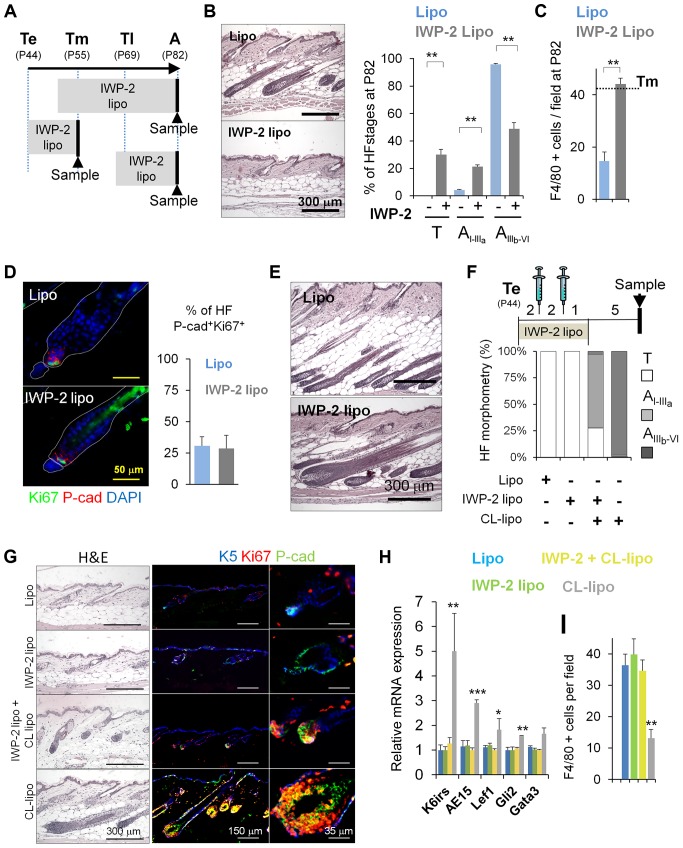
Figure 6. Inhibition of the production of Wnts by skin macrophages delays hair growth.
(A) Scheme illustrating the subcutaneous treatment with IWP-2-liposomes (IWP-2-lipo) to target mature phagocytic macrophages at different telogenic stages. Arrowheads indicate the time in which skin samples were collected. (B) Histological analyses of skin sections harvested at A (P82), after being treated with IWP-2-lipo starting before Tm (P50); n = 8. Quantification of the stage of HFs telogen (T), Early anagen (AI–IIIa), late anagen (AIIIb–VI); n = 8. (C) Histogram shows the quantification of the number of F4/80+ cells at A (P82), after being treated with IWP-2-lipo starting before Tm (P50). 10 fields/section/mouse were analyzed; n = 3. Dotted line represents Tm threshold levels. (D) Mice were injected in the backskin with IWP-2-lipo and Lipo controls starting at Te (P44). Samples were collected at Tm (P55), and processed for immunofluorescence analyses of Ki67 and P-cad (HG). The histogram shows the percentage of HFs with a HG positive for Ki67+Pcad+ cells; n = 3. (E) Histological analysis of skin sections harvested at A (P82) after being treated with IWP-2-lipo starting at P67, two days before Tl; n = 3. (F–G) Histomorphometric analysis of HF stages and histological analyses of skin sections of mice treated for 5 days with IWP2-lipo and Lipo controls. Over the curse of this treatment, CL-lipo and Lipo controls (syringes) were administered twice every 2 days. Samples were collected 6 days later. Immunostaining shows proliferating HG (Ki67+P-cad+). 100 HFs/mouse were analyzed; n = 6. (H) Relative mRNA expression of HF differentiation markers in total skin samples treated as described in (F); n = 6. (I) Histogram shows the quantification of the number of F4/80+ cells per field, after being treated as described in Figure 6F; n = 3. Note: n refers to the number of mice, per point per condition. *p≤0.05, **p<0.005; ***p<0.0005. All data used to generate the histograms can be found in Data S1.

