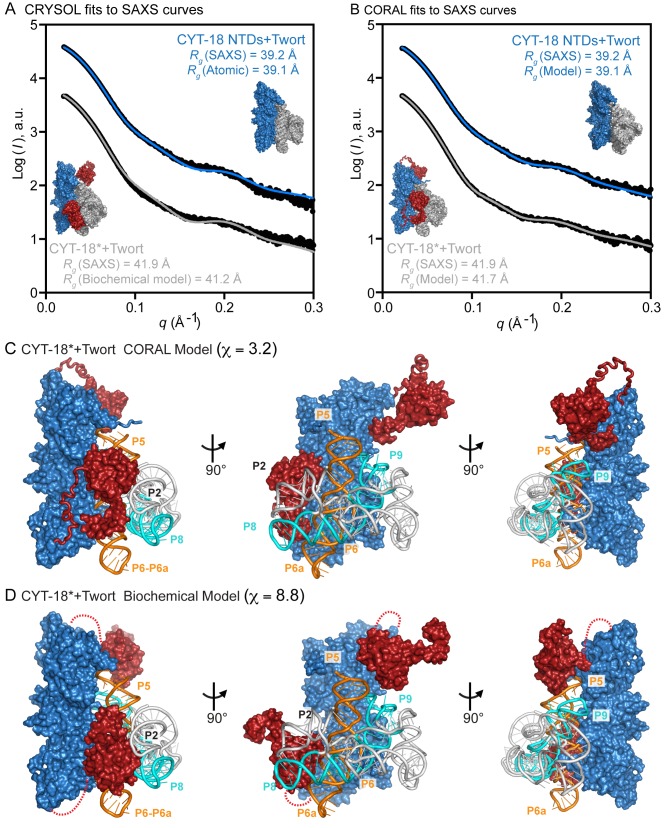
Figure 3. SAXS analysis and rigid-body modeling of CYT-18 proteins bound to the Twort ribozyme.
(A, B) Scattering profiles of the CYT-18 NTDs and CYT-18* bound to the Twort ribozyme displaced along the logarithm axis for visualization. (A) shows CRYSOL fits of the SAXS curves (black) to theoretical scattering curves calculated from the CYT-18 NTDs+Twort co-crystal structure (blue; χ = 4.4) and CYT-18+Twort RNA model structure based on biochemical data [37] (gray; χ = 8.8). The CYT-18 NTDs+Twort RNA co-crystal structure and CYT-18+Twort RNA biochemical model structure are shown alongside the plots together with the R g values calculated from the SAXS data and the structures. (B) shows fits of the SAXS curves (black) to the CORAL models of the CYT-18 NTDs+Twort (blue; χ = 2.2) and CYT-18*+Twort (gray; χ = 3.2). The CORAL models are shown alongside the plots together with the radii of gyration (R g) calculated from the SAXS data and the models. (C, D) CORAL and biochemical models of the CYT-18+Twort RNA complex, respectively. Three views of the models are shown with the CYT-18 NTDs colored blue and the two CTDs of the homodimer colored red. The unmodeled flexible linkers in the biochemical model are shown as dashed lines. The Twort group I intron RNA is depicted in gray cartoon representation with the P4–P6 domain in orange and the P3–P9 domain in cyan. Parts of intron RNA regions P2, P4–P5, P6–P6a, P8, and P9 are near and potentially interact with the CTDs.

