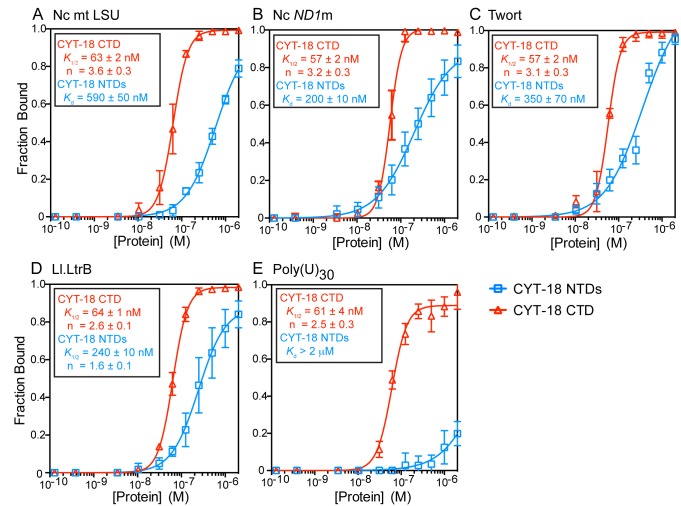
Figure 4. Equilibrium binding of CYT-18 NTDs and the CTD to various RNAs.
Binding assays of CYT-18 NTDs (blue) or CTD (red) to the (A–C) N. crassa mt LSU (Nc mt LSU), N. crassa ND1m (Nc ND1m), and Twort ribozyme group I intron RNAs, respectively; (D) L. lactis Ll.LtrB group II intron RNA; and (E) poly(U)30. For the binding assays, 32P-labeled RNAs were incubated with increasing concentrations of protein at 25°C for 30 min, a time verified to be sufficient to reach equilibrium (see Materials and Methods). The plots show the fraction of RNA bound to a nitrocellulose filter as a function of protein concentration with the CYT-18 NTDs-group I intron binding data fit to hyperbolic curves and the CYT-18 NTDs-Ll.LtrB and all CYT-18 CTD-RNA binding data fit to sigmoidal curves. Dissociation constant (K d) or K 1/2 values and Hill coefficient (n) are shown in (A–E) and are the mean for three experiments with the error bars indicating the standard deviation. Equilibrium-binding assays for the same proteins and RNAs at 37°C are shown in Figure S4.

