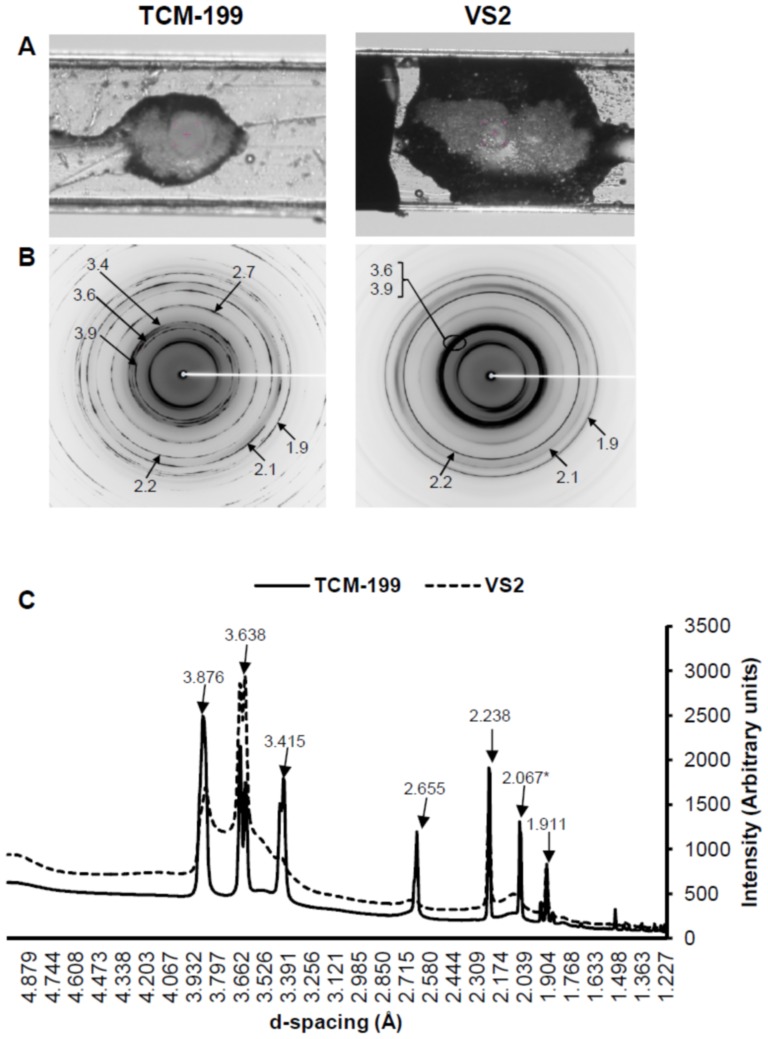
Figure 5. Physical appearance, 2D SXRD and 1D SXRD of bovine COCs in TCM-199 (non-vitrified control) and VS2 (vitrified) on cryotops at 102K.
A) Appearance of COCs through sample camera. B) Representative 2D SXRD with display of d-spacing. C) Representative 1D SXRD indicating the relative intensities of peaks vs. d-spacing. All peaks corresponded to the hexagonal ice crystals except one peak (*) which corresponded to NaH2PO4.H2O.

