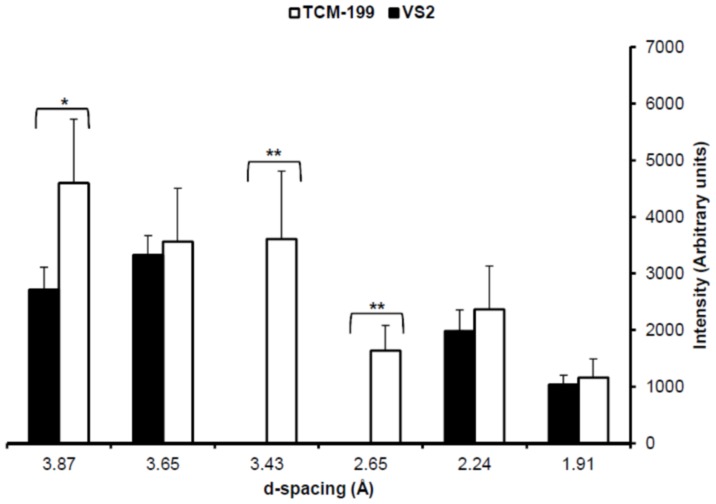
Figure 6. Ice peaks' intensities in bovine COCs in TCM-199 (non-vitrified control) or VS2 (vitrified).
Each bar represents mean±SEM (N = 5 COCs in each group). Asterisk (*) denotes the significant difference (P<0.05) in ice peak intensity between non-vitrified and vitrified COCs at a given d-spacing. Double asterisks (**) denote the presence of ice peaks in the non-vitrified COCs only.

