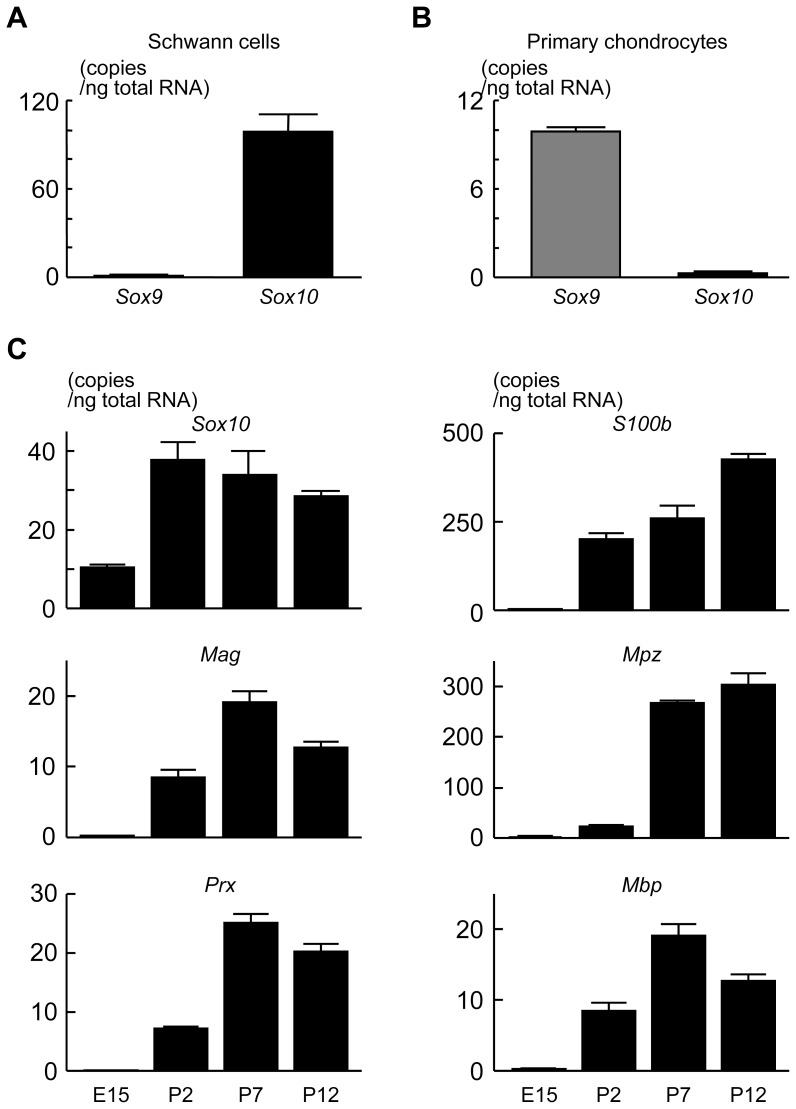
Figure 1. Expression pattern of Sox10 and other differentiation markers in Schwann cells.
(A and B) Comparison of expression level between Sox10 and Sox9 in primary rat sciatic nerve Schwann cells and primary rat rib chondrocytes. (C) Time course of mRNA levels of Schwann cell differentiation markers determined by real-time RT-PCR analysis during rat perinatal stages. All experiments were repeated independently three times with data shown as the mean (bars) ± SEM (error bars).

