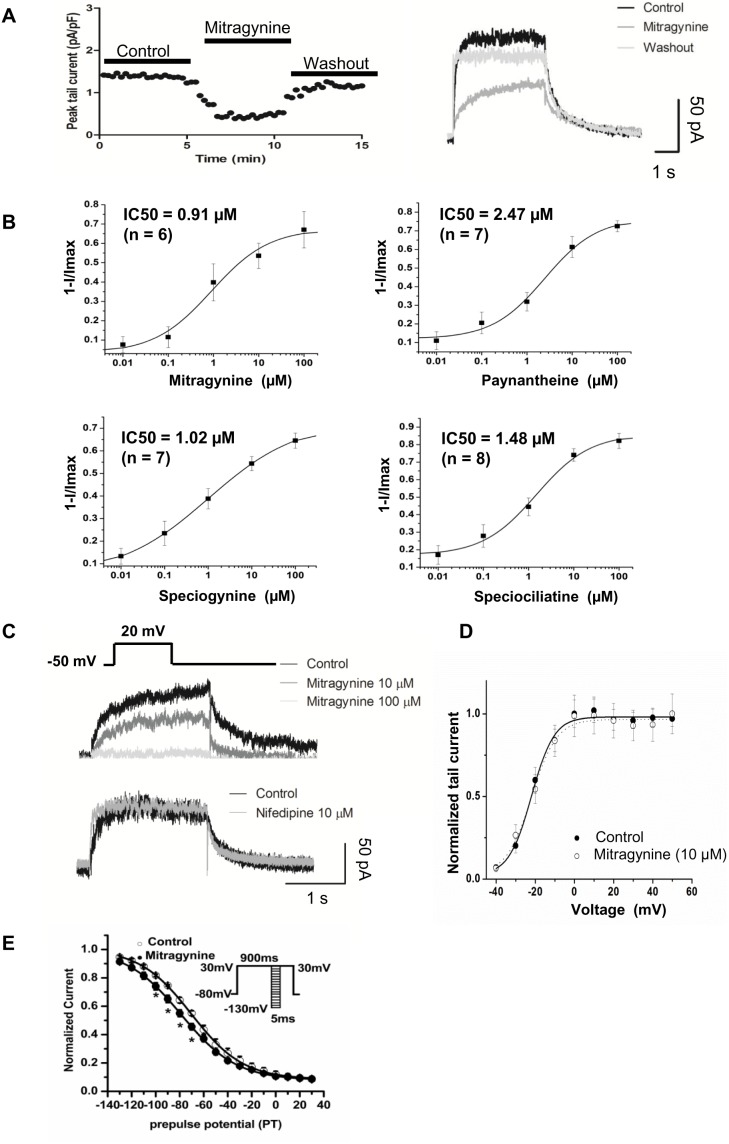
Figure 3. Mitragynine and its analogues suppressed I Kr in hiPSC-CMs.
(A) The time-course and wash out experiments in Mitragynine (n = 4). (B) The concentration dependence relationships of I kr peak tail current to Mitragynine, Paynantheine, Speciogynine and Speciociliatine with IC50 registered as 0.91, 2.47, 1.02 and 1.48 µM, respectively. (C) Voltage protocol (upper) used to elicit hERG and I k peak tail current traces with Mitragynine (middle) and nifedipine (bottom) exposure. Representative traces represent the whole cell currents (raw current) uncorrected for the presence of background currents. (D) Normalized steady-state activation curves of I Kr tail current prior to and post application of 10 µM Mitragynine (n = 5). (E) The steady-state inactivation properties of I Kr in hiPSC-CMs. Conditioning pulses between −130 and +30 mV in 10 mV increments for 5 milliseconds were applied after a depolarizing pulse to +30 mV for 900 milliseconds, followed by a common test pulse to +30 mV. The voltage protocol is illustrated in the inset. *p<0.05 (n = 5).

