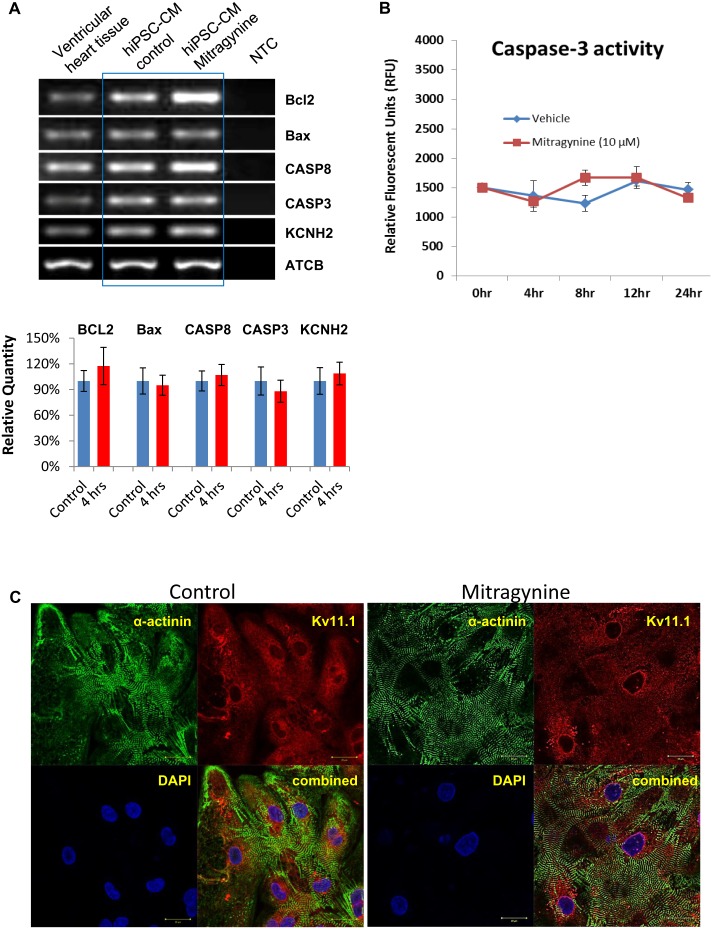
Figure 6. Mitragynine did not alter the expression of KCNH2 and Kv11.1 and the apoptosis-related genes in hiPSC-CMs.
(A) RT-PCR and real-time qPCR was performed with cDNA prepared from hiPSC-CMs prior to and 4 hours post Mitragynine (10 µM) treatment. (Top) Representative image of PCR products of KCNH2, Caspase 3, Caspase 8, Bcl2, Bax and ACTB are presented Human ventricular heart tissue cDNA was used as control. (Bottom) Relative quantity of PCR products of KCNH2, Caspase 3, Caspase 8, Bcl2, Bax measured by qPCR. (B) Caspase-3 activity measured in hiPSC-CMs treated with Mitragynine and vehicle (ethanol) for different time periods. (C) Representative images (with 3 repeats) of hiPSC-CMs immunofluorescently stained with α-actinin (green) and Kv11.1 (red) are presented. Kv11.1 staining shows similar intensity and distribution of hERG in hiPSC-CMs prior to and 4 hours post Mitragynine (10 µM) treatment. The identity of cardiomyocytes is confirmed by α-actinin staining.

