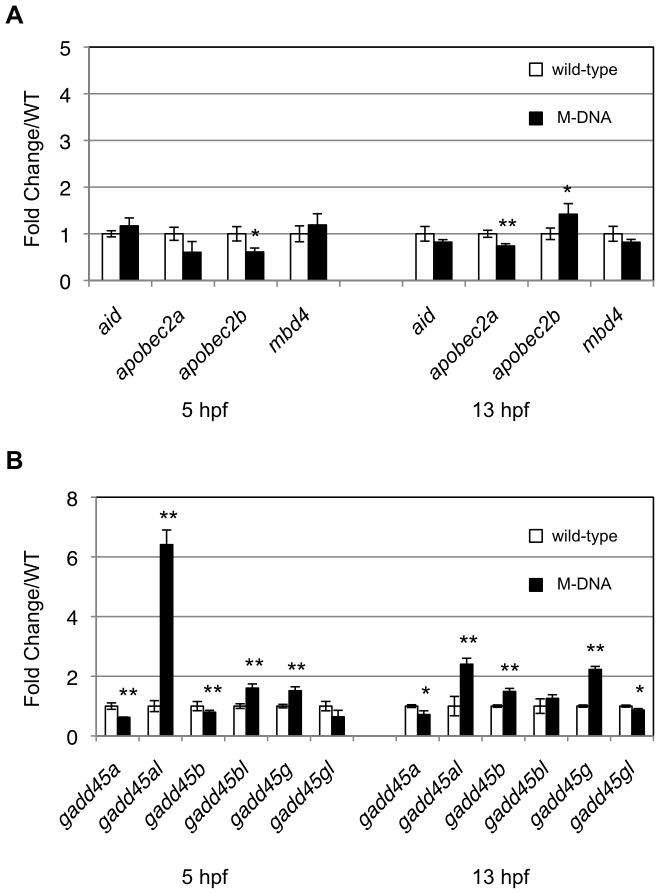
Figure 3. M-DNA did not induce the expression of aid or apobec2a.
(A) The expression levels of AID/Apobec family genes at the indicated time points were quantified by qPCR, and these expression levels in wild-type embryos (white rectangles) were compared with those in M-DNA-injected embryos (black rectangles). (B) The expression levels of Gadd45-family genes between wild-type and M-DNA-injected embryos were compared using qPCR. Gene expression was normalized against rpl13a (ribosomal protein L13a gene) and data represent the mean ± standard error of the mean (s.e.m.) from three independent experiments; **P<0.01 and *P<0.05.

