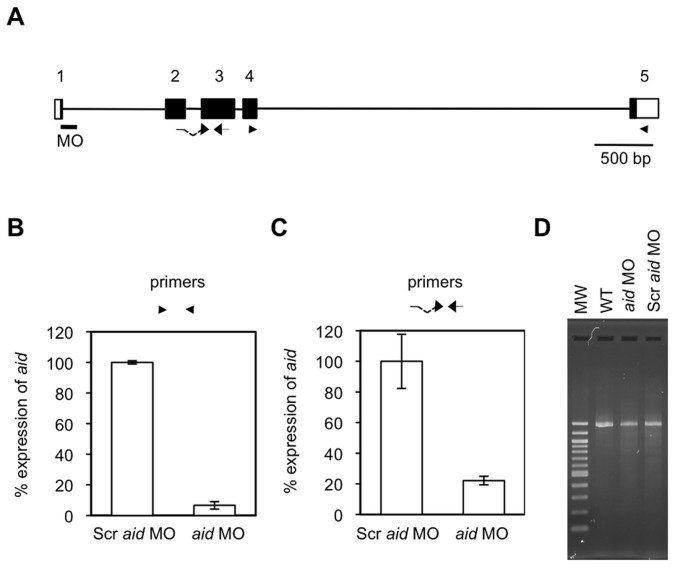
Figure 5. aid MO suppressed the expression of the aid gene.
(A) The genomic structure of the aid gene was drawn, as in Fig. 4 (B). (B) qPCR analyses of the aid transcripts from Scr aid MO and aid MO-injected AB/Tü embryos were conducted by the primer set shown as arrowheads in (A). Scr aid MO is a negative control for aid MO that has a scrambled sequence for aid MO. (C) A MO-induced reduction in the expression of aid was confirmed with Tü line by qPCR with a primer set that differed from the primer set used in (B), and was shown as arrows in (A). Gene expression was normalized against rpl13a, and data represent the mean ± standard error of the mean (s.e.m.) from three independent experiments. (D) cDNAs derived from wild-type (WT) and MO-injected embryos were used for 5′RACE of EF1a1. The products were checked as in (B).

