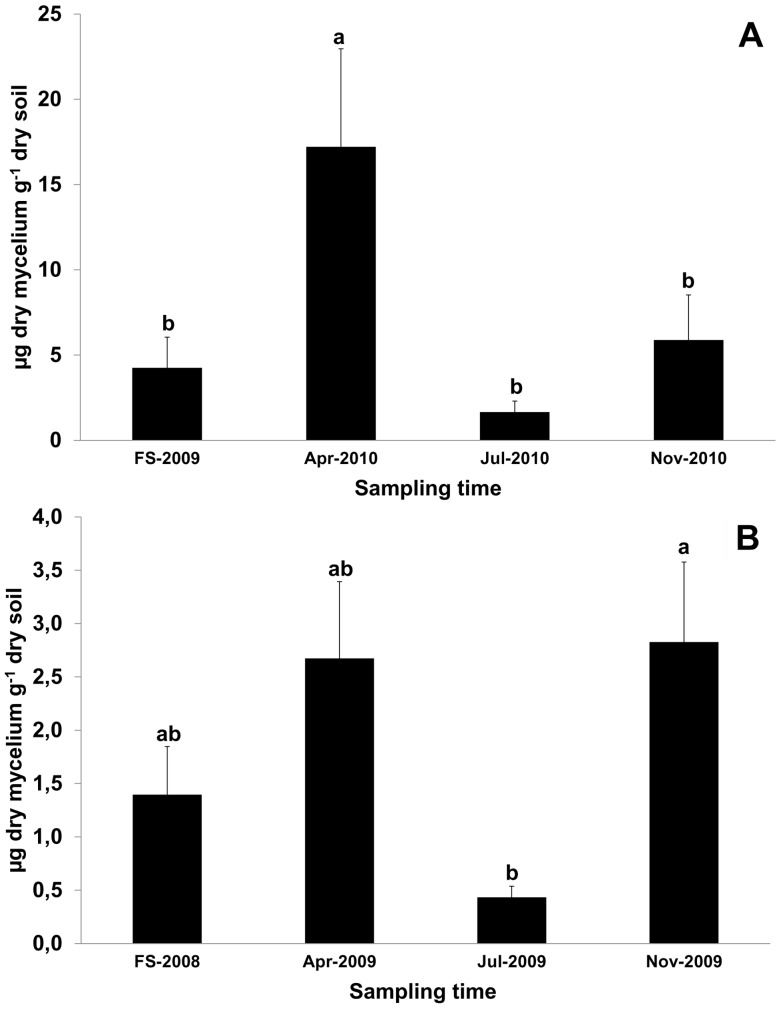
Figure 3. Mean amount of extra-radical soil mycelium of T. magnatum across four consecutive sampling periods.
Data are referred to Feudozzo (A) and Argenta (B) truffle grounds. FS = fruiting season: from 3-Nov-2009 to 3-Dec-2009 (A) and from 27-Oct-2008 to 18-Nov-2008 (B). Different scales are used on the y-axis because of the different range of values gathered from Argenta and Feudozzo. Error bars represent standard error (n = 21, 7 fruiting points ×3 sampling distances for each truffle grounds). Statistical analysis was carried out on log-transformed values [y = log(x+1)]. Different letters indicate significant differences between sampling periods (p<0.01 in A and p<0.05 in B).

