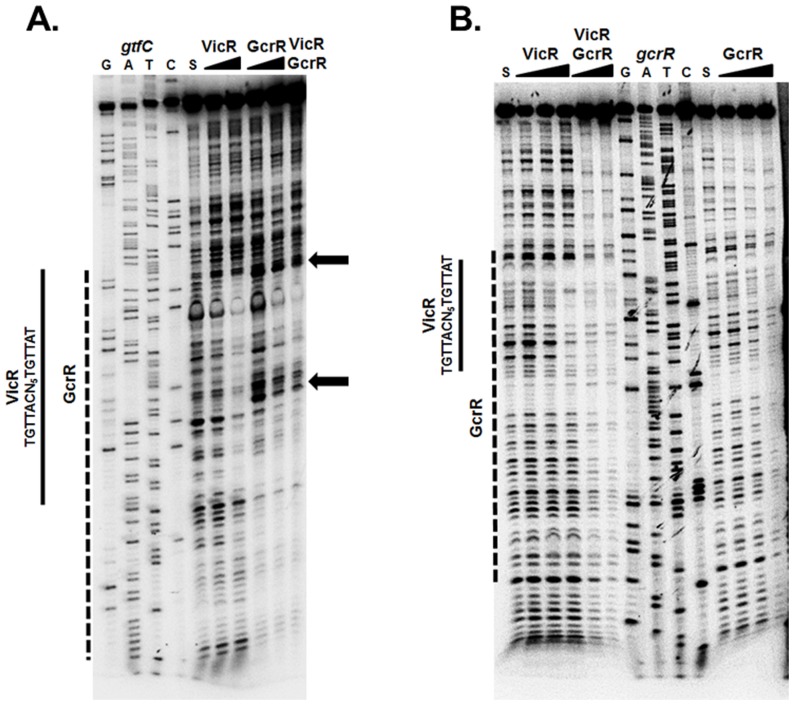
Figure 4. DNaseI footprinting of the gtfC and gcrR promoter regions.
(A) VicR or GcrR at increasing concentrations (0.25 and 0.5 µM) or a combination of VicR and GcrR at an equimolar concentration (0.5 µM) were incubated with labeled gtfC DNA substrate. The S above the fifth lane indicates the DNA substrate incubated in the absence of VicR/GcrR. The arrows designate the areas of enhanced cleavage by DNaseI. (B) Labeled gcrR DNA substrate was incubated with increasing concentrations of VicR or GcrR (0.125, 0.25, and 0.5 µM) or a mixture of VicR and GcrR at equimolar concentrations (0.25 and 0.5 µM). The S above the first and eleventh lanes indicates the DNA substrate incubated in the absence of VicR/GcrR. The solid line represents the region of protected nucleotides by VicR and the dashed line represents the region of protection by GcrR. The VicR consensus sequence is shown to the left of the solid lines.

