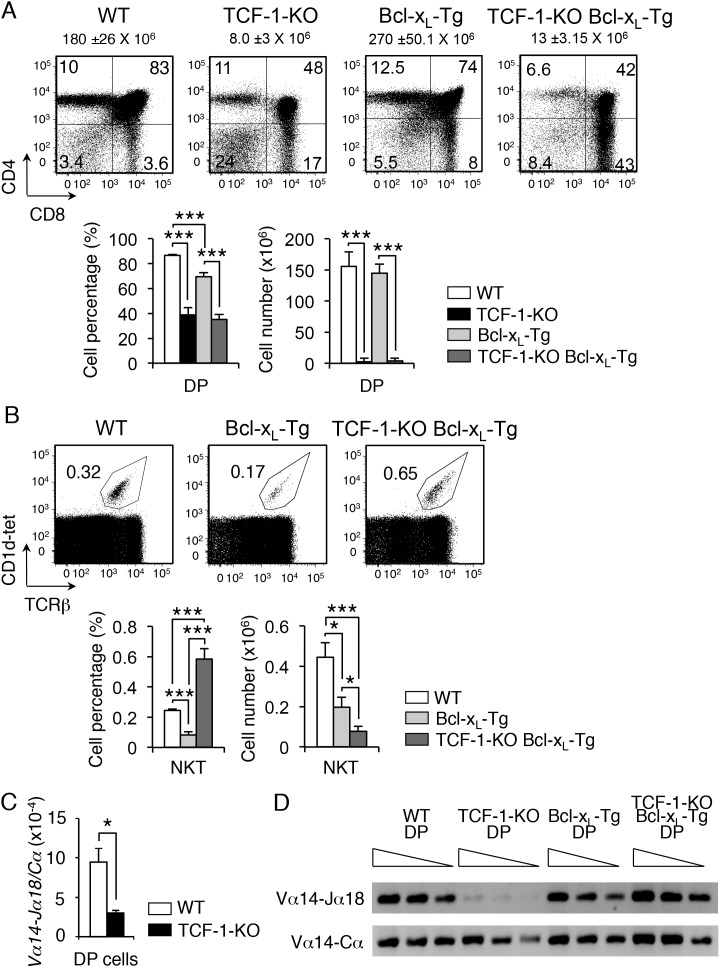
Figure 3. Ectopic expression of Bcl-xL in developing TCF-1-deficient thymocytes rescues Vα14-Jα18 rearrangements and NKT cells.
(A) Flow cytometry of thymocytes from WT, TCF-1-KO, Bcl-xL-Tg and TCF-1-KO Bcl-xL-Tg mice showing CD4−CD8− (double-negative, DN), CD4+CD8+ (double positive, DP), CD4 single-positive (SP) and CD8SP thymocytes. Top, dot plots are representative of at least 4 different experiments. Bottom, graphs with DP cell percentages and cell numbers from 4 mice per group are shown (mean and s.e.m.). Numbers over dot plots refer to total thymocyte cell numbers. (B) Flow cytometry of thymocytes showing percent of gated CD1d-tetramer+ TCRβ+ NKT cells from WT, Bcl-xL-Tg and TCF-1-KO Bcl-xL-Tg mice. Top, dot plots are representative of at least 4 different experiments. Bottom, graphs with NKT cell percentages and cell numbers from 4 mice per group are shown (mean and s.e.m.). (C) Relative expression of Vα14-Jα18 rearrangements from WT and TCF-1-KO DP cells (n = 3). (D) Semiquantitative PCR of cDNA (1∶1, 1∶2, 1∶4 dilutions) from DP cells of WT, TCF-1-KO, Bcl-xL-Tg and TCF-1-KO Bcl-xL-Tg mice showing Vα14-Jα18 and control Vα14-Cα rearrangements (n = 3). *P<.05; ***, P<.001.

