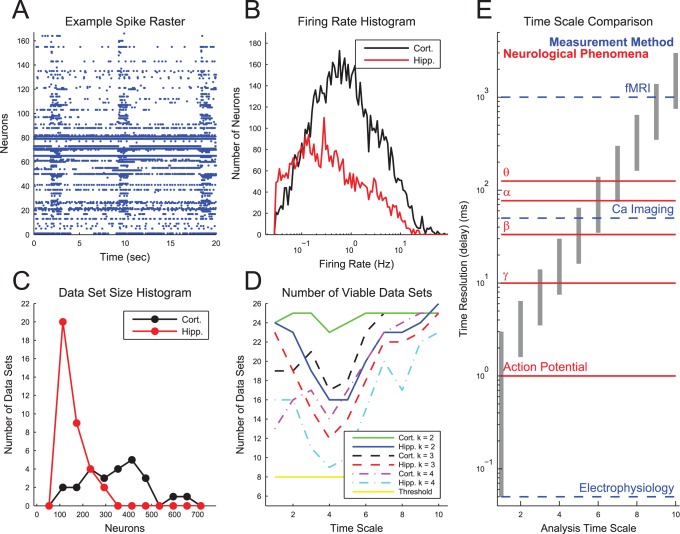
Figure 1. Analysis time scales and basic data properties.
(A) Example spike raster from a cortical recording. (B) Firing rate histogram of neurons in all hippocampal and cortical recordings. (C) Histogram of the number of neurons in each recording. (D) The number of viable data sets or recordings. Data sets were deemed viable if they produced sub-networks with at least 50 neurons and a given average degree (k). We used sub-networks with k = 3 throughout the analysis. (E) Time resolutions for the 10 discrete time scales used in this analysis in comparison to the approximate time scales for various neurological phenomena and measurement methods. Note that some measurement methods (e.g. MEG and EEG (forms of electrophysiology), as well as fMRI) are not capable of recording the activity of individual neurons, unlike calcium imaging or cellular electrophysiology (as was used in this study). The analysis time scales were chosen to logarithmically span many neurological time scales and they allowed us to compare network structure on this wide range of time scales. Note that the analysis time scales overlap to ensure that all phenomena are adequately measured.

