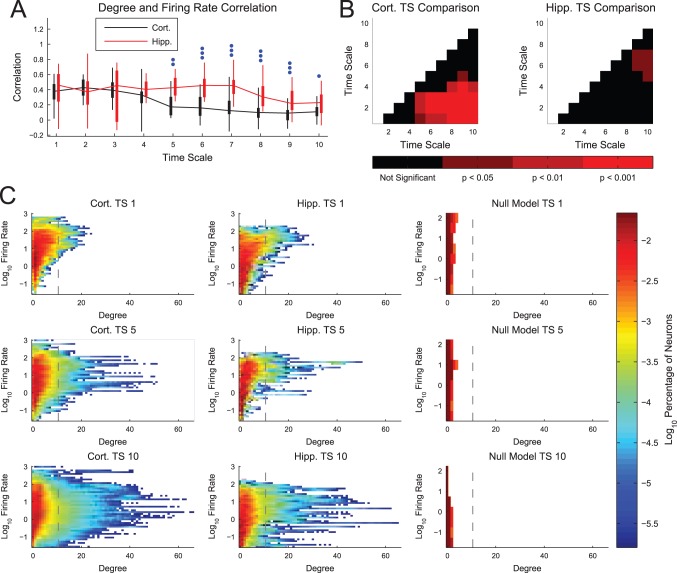
Figure 3. Firing rate and degree were correlated.
(A) Neuron firing rate and degree were correlated, especially for short time scales. Hippocampal networks showed higher correlations than cortical networks for middle and long time scales. Box plots: minimum, 25th percentile, median, 75th percentile, maximum data set (recording). Differences between hippocampal and cortical networks were assessed with a multiple comparisons corrected Mann-Whitney Test (one dot: p<0.05, two dots: p<0.01, three dots: p<0.001). (B) The correlation between firing rate and degree generally decreased with time scale. Multiple comparison corrected Mann-Whitney Test p-values between different time scales for the same tissue type. (C) Density plots of neuron degrees and firing rates in sub-networks. Note that the real data contain many high degree neurons and the stronger correlation between degree and firing rate for short time scales (top row) in comparison to longer time scales. Also, note that the null model data contained very few non-zero degree neurons. This lack of connectivity in the null model implies that high degrees for high firing rate neurons are not the result of false-positive connections. Vertical line is the approximate degree threshold for hub classification.

