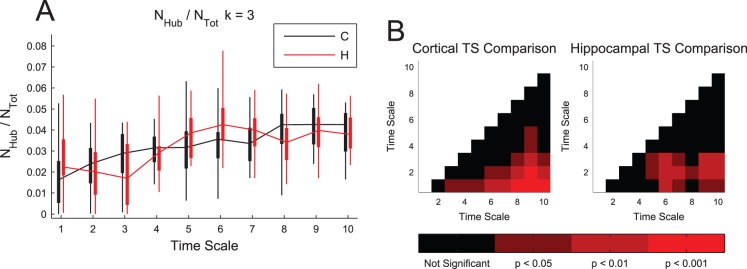
Figure 4. A small and consistent percentage of neurons were found to be hubs.

(A) Most data sets exhibited a small, but significant number of hubs across all time scales. Note that the likelihood for a randomly connected neuron to be found to be a hub was set at 10−4 (see Materials and Methods), so these results indicate a roughly two order of magnitude increase in the number of hubs over a random network. Box plots: minimum, 25th percentile, median, 75th percentile, maximum data set (recording). No significant differences were found between hippocampal and cortical networks. (B) Multiple comparison corrected Mann-Whitney Test p-values between different time scales for the same tissue type. The number of hubs generally increased with time scale.
