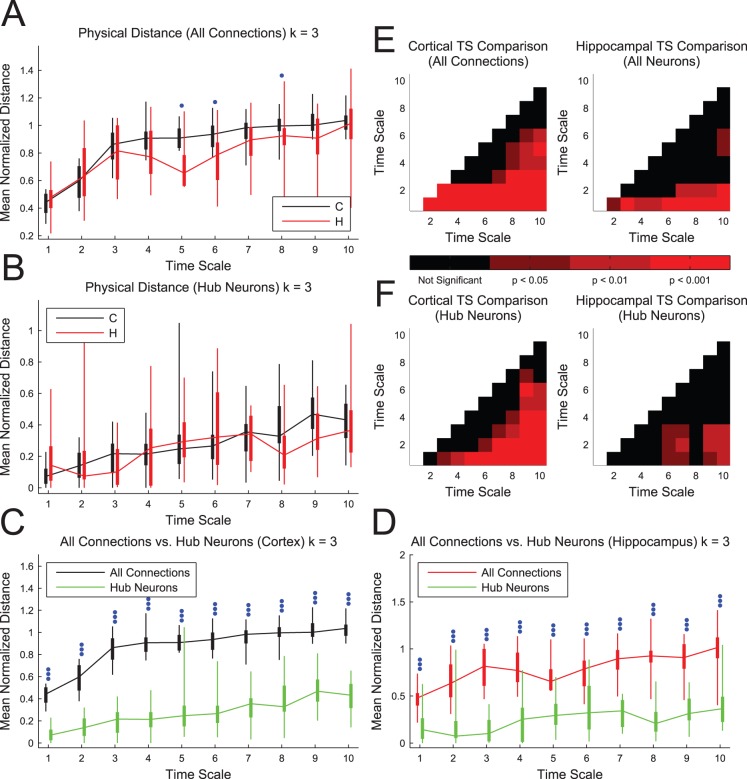
Figure 6. Physical distance between connected neurons increased with time scale and hubs were closely spaced.
(A) The mean physical connection distance was calculated as the ratio of the mean physical distance between effectively connected neurons in the network to the mean physical distance between all possible pairs of neurons in the sub-network. Cortical networks were found to be significantly larger for several time scales. (B) The mean physical distance between hubs was calculated as the ratio of the mean physical distance between hubs (connected or not connected) to the mean physical distance between all possible pairs of neurons in the sub-network. No significant differences between hippocampal and cortical networks were observed. (C and D) The hubs were significantly more closely spaced than the average connected pair. Box plots: minimum, 25th percentile, median, 75th percentile, maximum data set (recording). Differences between hippocampal and cortical networks were assessed with a multiple comparisons corrected Mann-Whitney Test (one dot: p<0.05, two dots: p<0.01, three dots: p<0.001). (E and F) Multiple comparisons corrected Mann-Whitney Test p-values between different time scales for the same tissue type for connection distances (E) and hub distances (F). Note that cortical and hippocampal network connections tend to be significantly longer in time scales 3 to 10 in comparison to time scales 1 and 2. Also, note that hub distances generally increase with time scale.

