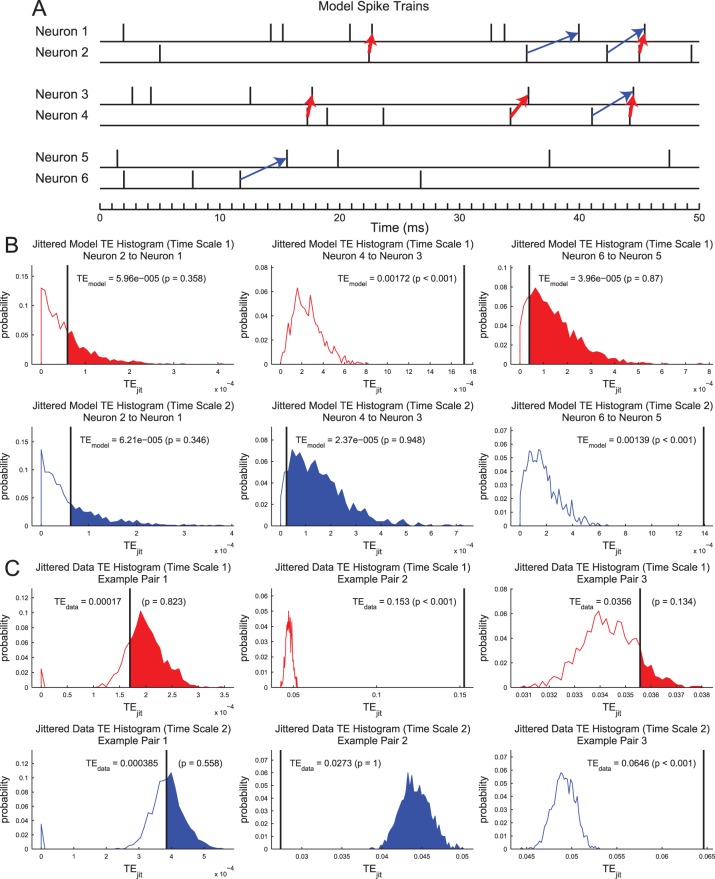
Figure 11. The TE analysis method isolated time scale specific interactions.
(A) Spike trains for 6 model neurons. All neurons spike randomly (Poisson) at 100 Hz and were recorded for 60 seconds. (B) Jittered TE histograms for the model neurons for the two shortest time scales. Neurons 1 and 2: Independent spiking. TE results are not significant for either time scale. Neurons 3 and 4∶5% of neuron 3 spikes were moved to follow 1.5 ms after neuron 4 spikes. A significant TE result is found for the first time scale (0.05 ms to 3 ms), but not for the second time scale (1.6 ms to 6.4 ms). Neurons 5 and 6∶5% of neuron 5 spikes were moved to follow 4 ms after neuron 6 spikes. A significant TE result is found for the second time scale (1.6 ms to 6.4 ms), but not for the first time scale (0.05 ms to 3 ms). (C) Example jittered TE histograms from real data that show similar features to model neuron pairs.

