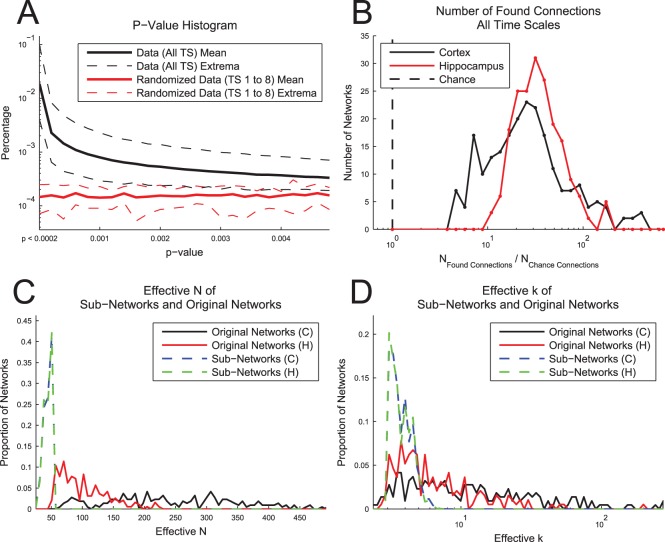
Figure 12. Connectivity statistics.
(A) TE p-value histogram for real and randomized data. Real data show many more pairs of neurons with low p-values compared to randomized data. In this analysis, the p-value threshold was set at less than 0.001. The extrema correspond to the time scale with the largest or smallest percentage value for a given p-value. (B) Number of found connections. The number of connections found in each network was at least 4 times larger than expected by chance, with most networks containing 10 to 100 times more connections than expected by chance. (C) Effective N values. The effective N for each network is the number of connected nodes in the network. The mean ± STD in the original data (sub-networks) was 241±103 (42±7) for cortical networks and 128±54 (42±7) for hippocampal networks. (D) Effective k values. The effective k for each network is the average number of connections (degree) per neuron. The mean ± STD in the original data (sub-networks) was 22±30 (3.7±0.7) for cortical networks and 11±18 (3.7±0.8) for hippocampal networks. Note that the sub-network procedure significantly reduced the variability of the effective N and k values, as well as the differences in effective N and k between tissue types.

