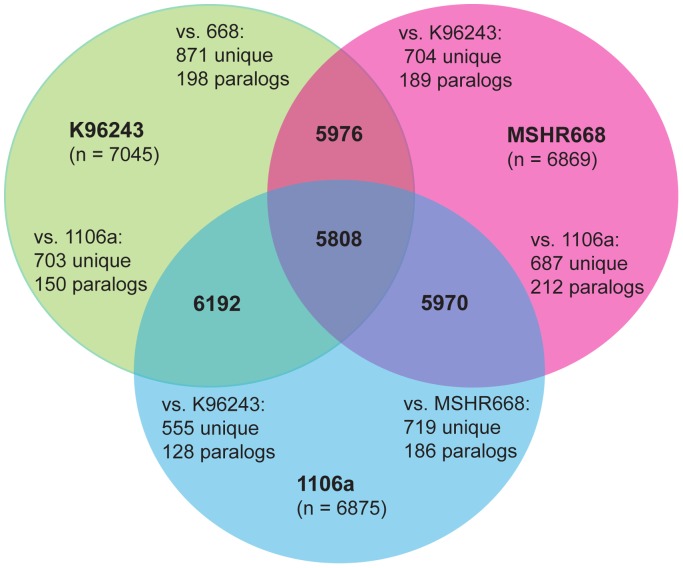
Figure 2. Venn diagram illustrating the numbers of CDS shared by B. pseudomallei strains K96243, MSHR668 and 1106a, determined by a bidirectional best BLAST hits analysis.
The number of CDS unique to each genome in each pairwise comparison and the number of putative paralogs are shown. The total number of CDS present in each genome is given below the genome name.

