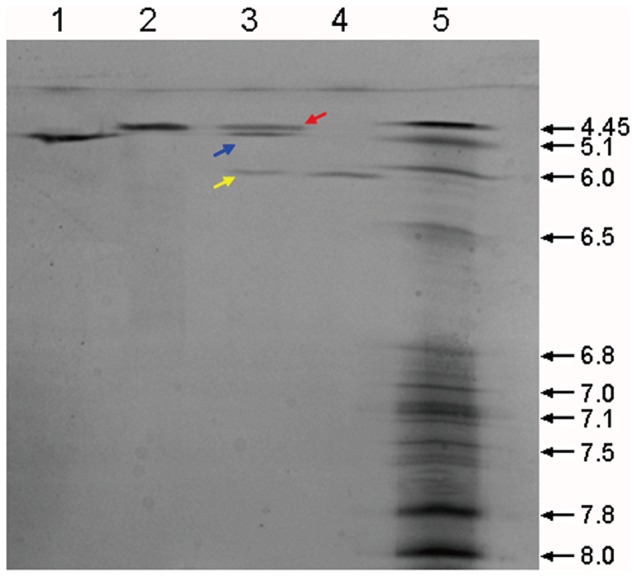
Figure 3. Isoelectric focusing electrophoresis analysis of HMG.

Isoelectric focusing electrophoresis was conducted for HMG (Lane 1), HSA (Lane 2), HSA plus mG-CSF and HMG (Lane 3), and mG-CSF (Lane 4). An IEF marker was loaded in Lane 5. The red arrow represents the band of HSA, the blue arrow represents the band of HMG and the yellow arrow represents the band of mG-CSF.
