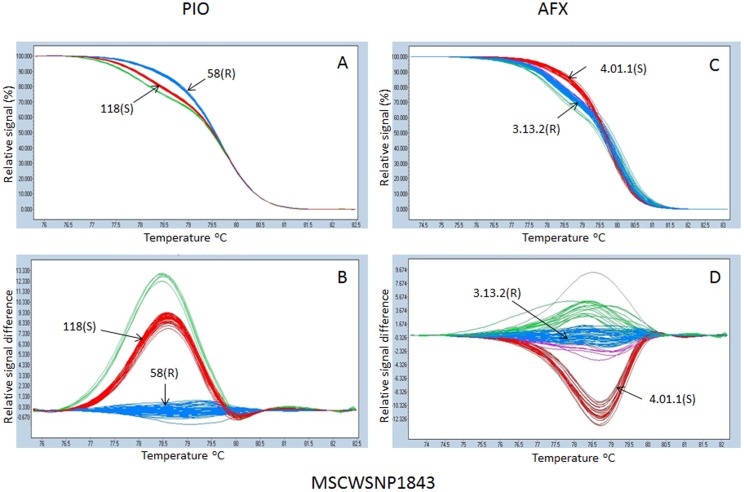
Figure 2.
High resolution melting profiles of SNP markers MSCWSNP1843 in the Pioneer (PIO) (A, B) and Alforex (AFX) (C, D) populations. The real time PCR was performed by LightCycler 480) and the HRM profiles were analyzed using the gene scanning module software. Normalized melting curves (A, C) and temperature shift difference plots (B, D) are presented. Three groups of genotypes were distinguished by three colors (red, blue and green). Melting curves for parents in each population are indicated by arrows. Resistant parents: 58(R) = 55V50-58(R) (Pioneer) and 3.13.2 (R) = CW065006-3-13-2 (R) (Alforex), susceptible parents: 118(S) = 55V50-118(S) (Pioneer) and 4.01.1(S) = CW065006-4-01-1(S) (Alforex).

