
Figure 2. Hepatocellular steatosis, hypertrophy and inflammation.
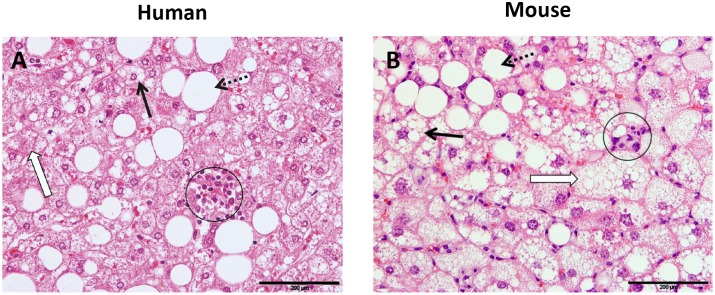
Liver cross-sections are from a NASH patient (A) or a E3L.CETP mouse fed a high fat diet supplemented with cholesterol to induce NASH (B). Macrovesicular steatosis (dotted line arrow): large lipid droplets are present in hepatocytes; microvesicular steatosis (bold arrow): small lipid droplets are present in hepatocytes. Hypertrophy (open arrow): the representative cell is much larger than the surrounding steatotic hepatocytes but has the same cytoplasmic characteristics. Clusters (aggregates) of inflammatory cells (within circles). All photomicrographs: Hematoxylin and eosin; magnification 200x.