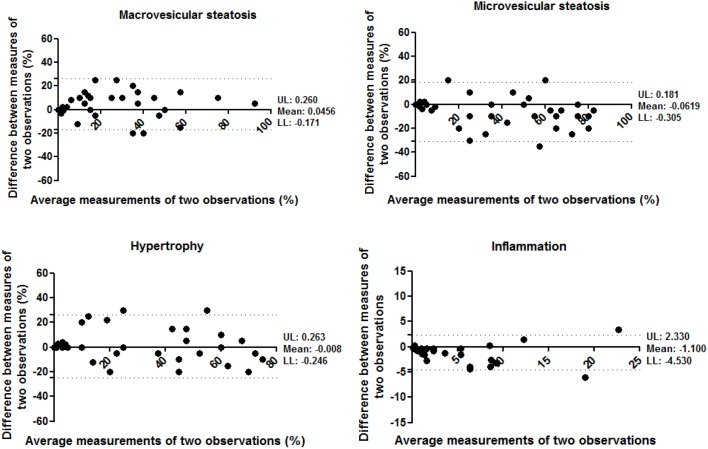
Figure 5. Bland-Altman plot for correlation analysis between two observations of one observer for measurement of macrovesicular steatosis, microvesicular steatosis, hypertrophy and inflammation.
X-axis: average measurements of two observations. Y-axis: Difference between measurements of two observations. UL: Upper 95% limits of agreement. LL: Lower 95% limits of agreement.

