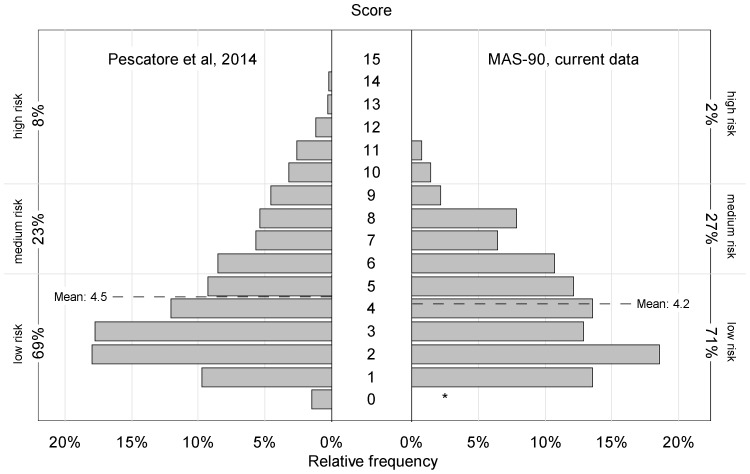
Figure 1. Score distribution (relative frequency) from model building sample.
(n = 1226, left side, from [13]) and external validation sample (n = 140, right side). Primary inclusion, scoring and outcome definitions. * no child with age 1 year in external validation sample (score 0 not possible).

