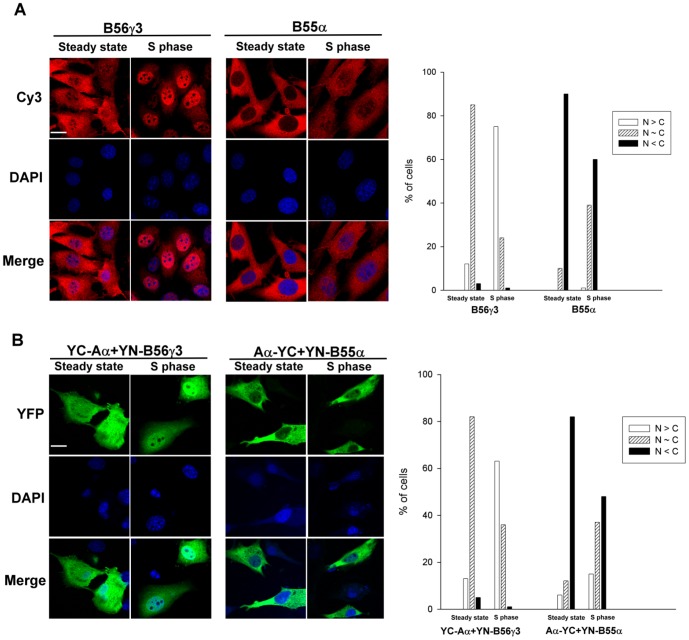
Figure 3. BiFC analysis confirms that B56γ3, but not B55α, promotes PP2A/Aα accumulation in the nucleus in early S phase.
(A) NIH3T3 cells stably expressing HA-tagged B56γ3 or B55α were synchronized at the early S phase by double thymidine block treatment [48] followed by released in the regular medium for 3 h as described before [29]. Expression of B56γ3 or B55α was assessed by indirect immunofluorescence using anti-HA antibody in conjunction with Cy3-conjugated secondary antibody. (B) Equal amounts of BiFC expression constructs encoding YC-Aα and YN-B56γ3 or equal amounts of BiFC expression constructs encoding Aα-YC and YN-B55α were co-transfected into NIH3T3 cells. Twenty-four hour after transfection, cells were either treated with 10 µg/ml aphidicolin or left untreated for 18 h and subsequently grown in fresh medium without aphidicolin treatment for 3 h, followed by direct fluorescence microscopy for imaging YFP signals due to BiFC of YC-Aα and YN-B56γ3 or BiFC of Aα-YC and YN-B55α. DAPI was applied for staining of nuclei. Scale bars, 20 µm. Graphs show quantitative analysis of distribution of BiFC signals in cells from one of at least two independent experiments with similar results, and at least 100 cells were assessed from several random fields. Cells with different distribution patterns of BiFC signals were scored as described earlier.

