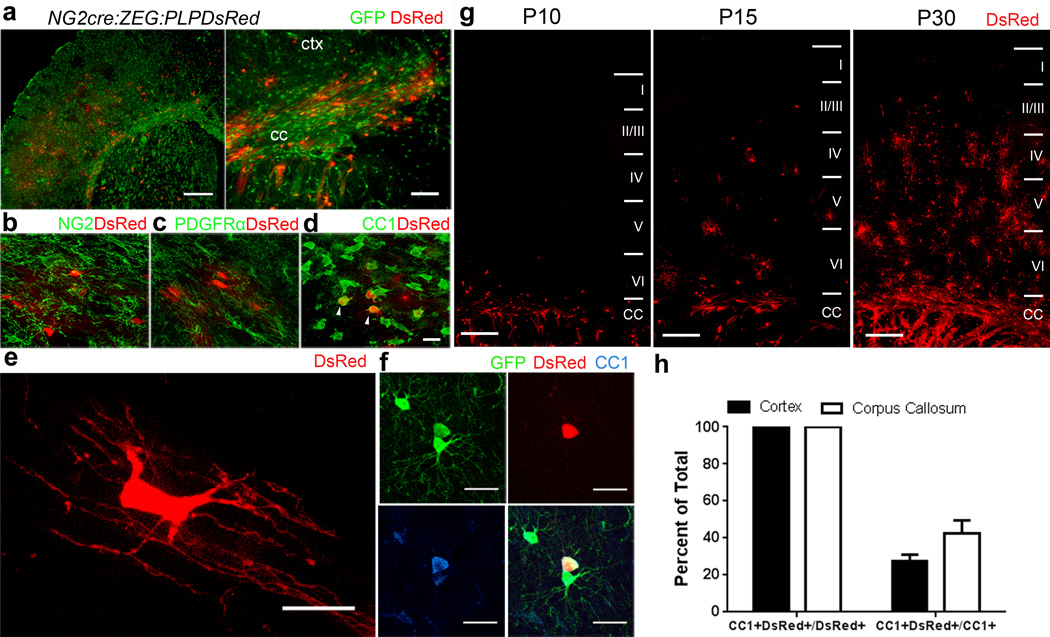
Figure 2. NG2cre:ZEG:PLPDsRed triple transgenic mice identify cells at distinct stages of oligodendrocyte differentiation.
(a) Low magnification images taken from the forebrain of fixed tissue from P15 NG2cre:ZEG:PLPDsRed transgenic mice. (b–d) High magnification images taken from P15 corpus callosum immunostained for NG2 (b), PDGFRα (c) or CC1 (d) showing DsRed fluorescence in a subpopulation of CC1+ cells (arrowheads) but not in NG2 cells that are NG2+ or PDGFRα+. (e) High magnification image of a DsRed+ oligodendrocyte in the corpus callosum showing typical myelinating oligodendrocyte morphology with multiple parallel processes. (f) Example of a cortical GFP+DsRed+ cell that is also CC1+. (g) Low magnification images of DsRed expression at P10, P15 and P30 in the cortex (layers I–VI) and corpus callosum (CC) showing the increase in the density of DsRed expressing oligodendrocytes during the first month of postnatal development. Scale bars 100 μm and 50 μm in a, 25μm in b–d and 250μm in g. (h) Quantification in PLPDsRed transgenic mice demonstrating that DsRed+ cells represent a minor subset of CC1+ cells in the cerebral cortex and corpus callosum. Error bars = SD.

