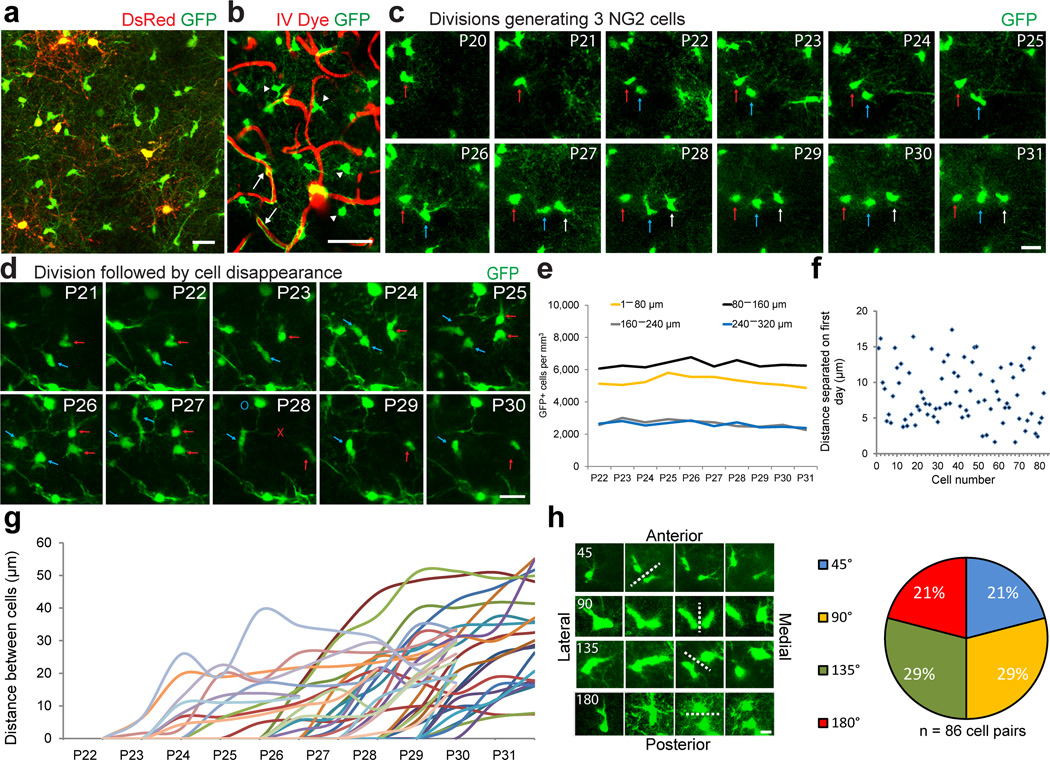
Figure 3. Longitudinal in vivo imaging of cortical NG2 cells.
(a) Example in vivo two-photon image captured with 975nm laser excitation from a P25 NG2cre:ZEG:PLPDsRed triple transgenic mouse. (b) Image captured in vivo from the somatosensory cortex of an NG2cre:ZEG transgenic mouse intravenously injected with Texas Red dextran to visualize the cortical vasculature showing the distinction and identification of GFP+ (green) NG2 cells (arrowheads) and vascular pericytes (arrows). Scale Bar = 50μm. (c) Montage of images of the same GFP+ NG2 cells captured daily from P20–P31, showing two cell divisions (arrows) over the imaging period. Scale Bar = 20μm. (d) Montage of images captured from P21–P30 showing individual GFP+ cells dividing (arrows) and then disappearing (red X) or migrating out of the field of view (blue O) 4 days after division Scale Bar = 20μm. (e) The density of GFP+ cells from P22–P31 by cortical depth. (f) Graph showing the distance between individually divided GFP+ cell pairs one day after cell division. (g) Cell separation trajectories of a subset of imaged GFP+ cell divisions depicting the distance between divided cells over the imaging period. (h) Example images of four types of division angles relative to brain orientation, with dotted line indicating division plane and time of division. Scale Bar = 10 μm. Quantification of each type of division from 86 cell division events.

