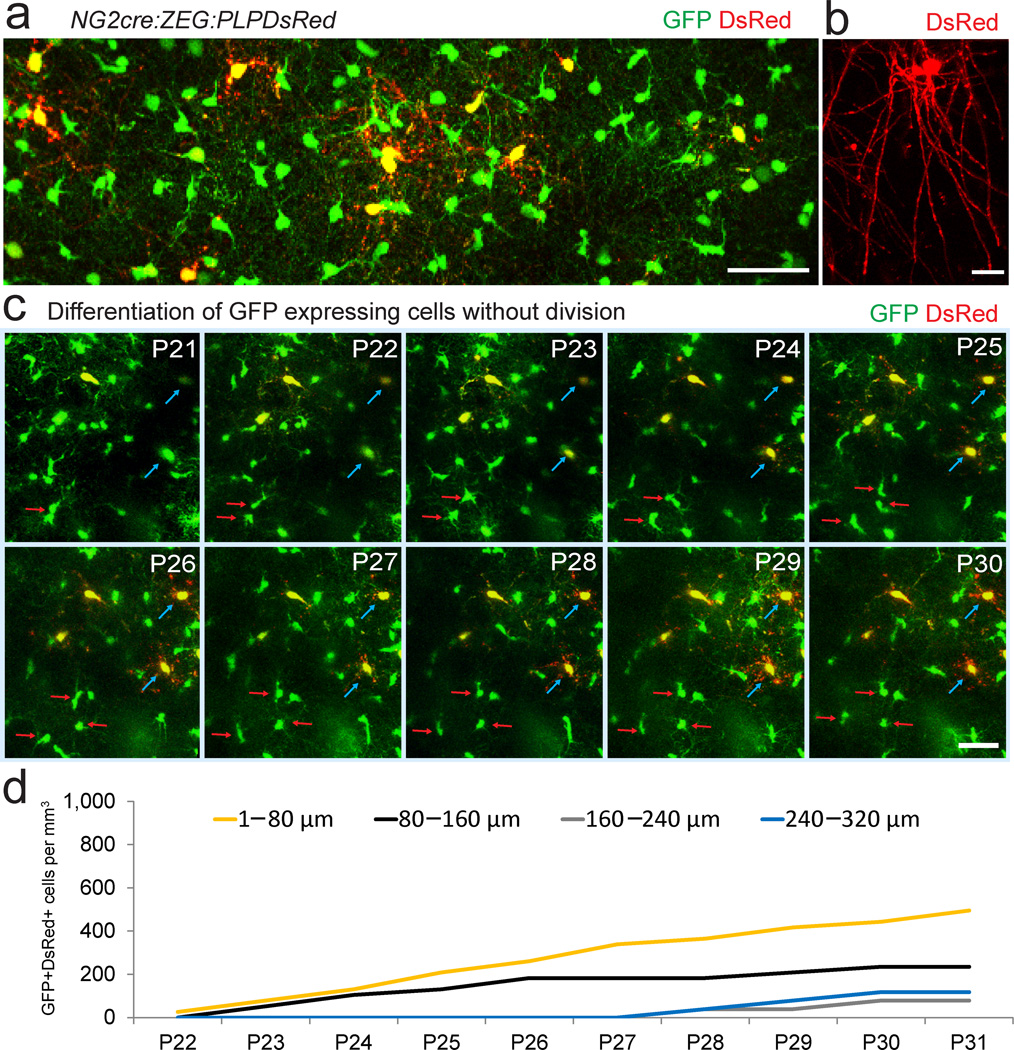
Figure 4. In vivo imaging of oligodendrocyte differentiation.
(a) Two-photon fluorescence image captured in vivo from the somatosensory cortex from a P35 NG2cre:ZEG:PLPDsRed transgenic mouse showing GFP+ NG2 cells, GFP+ oligodendrocytes, and GFP+ DsRed+ mature oligodendrocytes. Scale Bar = 50μm. (b) High magnification in vivo image of a single DsRed+ oligodendrocyte showing the distinctive morphology of a mature oligodendrocyte. Scale bar = 20μm. (c) Time-lapse sequence from P21–P30 showing dividing GFP+ cells (red arrows) and other GFP+ cells gradually becoming DsRed+ (blue arrows), but no GFP+ cell dividing and becoming DsRed+. Scale Bars = 50μm. (d) The density of GFP+DsRed+ cells appearing from P22–P31.

