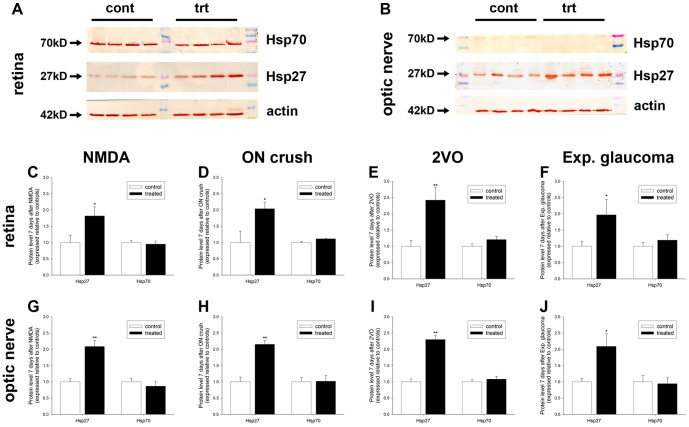
Figure 3. Characterization of Hsp27 and Hsp70 proteins in the retina and optic nerve during RGC injury.
A, B: Representative Hsp27, Hsp70 and actin immunoblots in control (cont) and injured (trt) samples. Single bands of the expected molecular weight are apparent. C-J: Levels of Hsp27 and Hsp70 proteins. Values (represented as mean ± SEM) are normalised for actin and expressed relative to controls. *P<0.05, **P<0.01 by Student's unpaired t-test.

