
Figure 2.
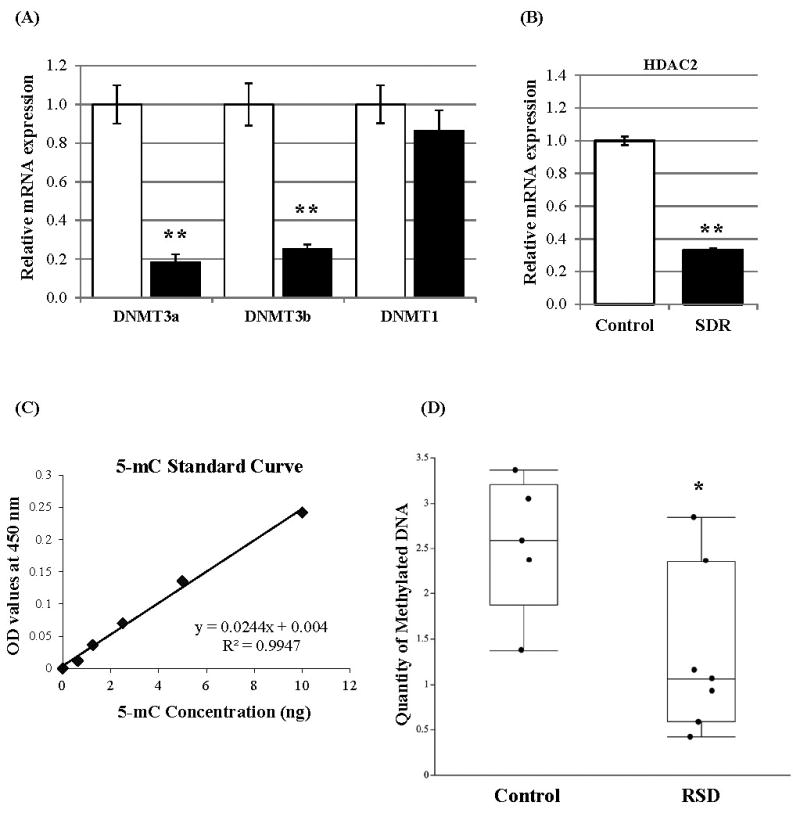
Effects of the 6-cycles of RSD on mRNA expression of chromatin modification-associated proteins and status of DNA methylation in splenic macrophages (CD11b+ cells).
(A) mRNA expression of DNA methyltransferases DNMT3a, DNMT3b, and DNMT1 in the control (clear bar) and RSD (filled bar) groups (mean ± SEM, n = 8/group)
(B) mRNA expression of histone deacetylase 2 (mean ± SEM)
(C) Standard curve plot for OD values observed at 450 nm vs. concentrations of control methylated DNA (5-mC)
The coefficient of determination (R2) for the linear regression is 0.9947.
(D) The absolute amount of methylated DNA in splenic macrophages (CD11b+ cells) in control and RSD groups (mean ± SEM)
*: p< 0.001; **: p< 0.0001