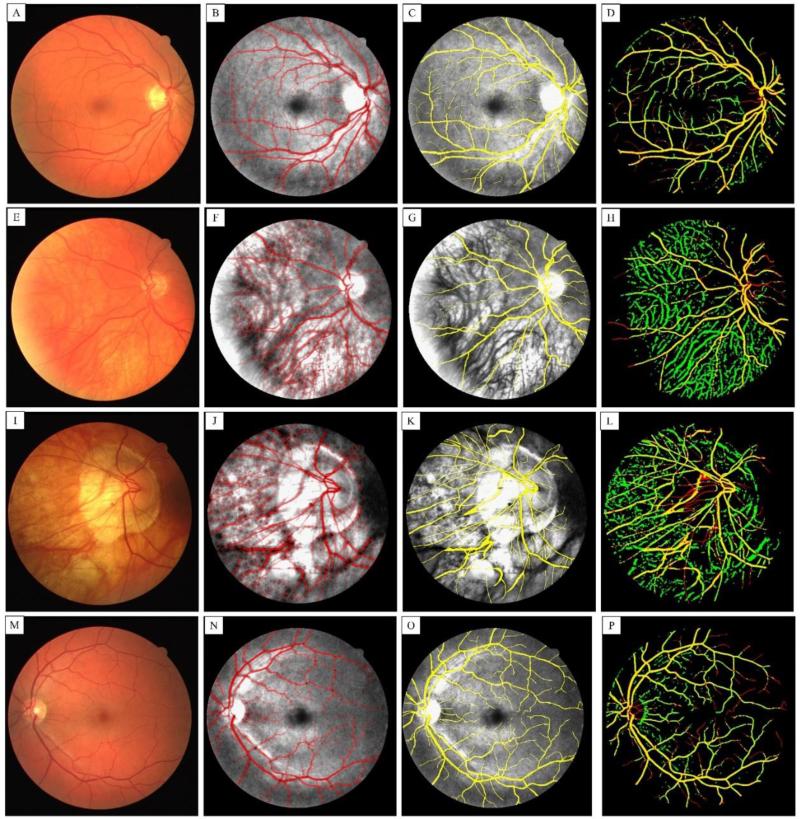
Fig. 8.
First column (A, E, I and M) shows fundus camera of four different retina images from the DRIVE dataset. The second column (B, F, J and N) shows the corresponding segmentation results using our combined technique overlaid on top of the equalized green channel where red color shows segmented vessel and gray areas show non-segmented background. The third column (C, G, K and O) shows the result of manual segmentation (gold standard) coded with yellow color overlaid on the green channel of fundus image. The last column (D, H, L and P) shows the corresponding segmentation comparison where the yellow color indicates true positive, red color indicates true negative and green value indicates false positive segmentation results. For the cases that retina layer was thinned (second and third row), the choroid vasculature have also been segmented into the image.

