
Figure 1. miR-124 levels inversely correlate with hypoxia signatures in glioblastoma patients and are further decreased in pseudopalisading necrotic regions within patient tissues.
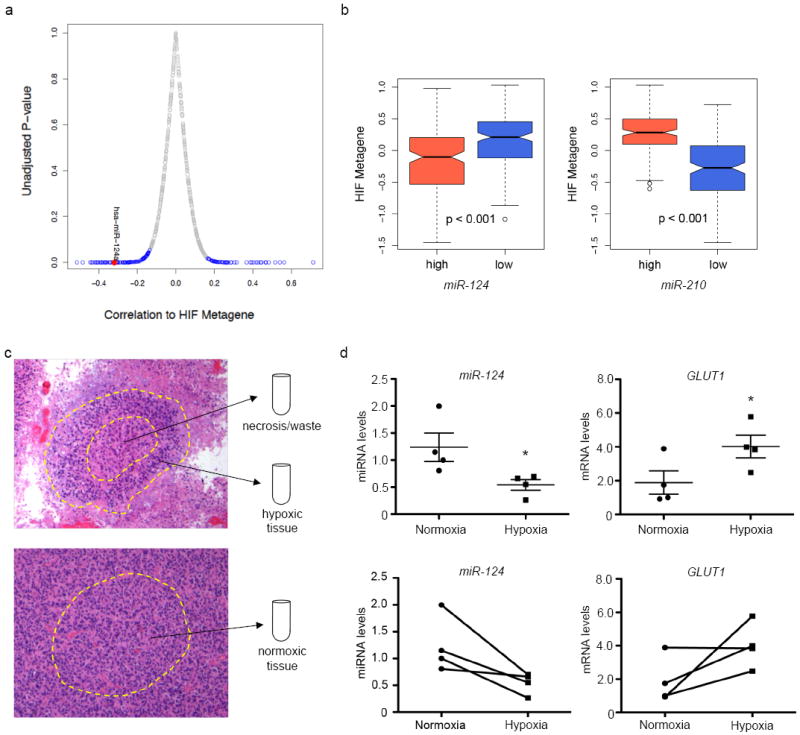
(a) Hypoxia Inducible Factor (HIF) metagene correlation to miRNA levels. MiRNAs that are positively and negatively correlated with the metagene are indicated blue = p - value < 0.05. Red dot = miR-124. (b) HIF metagene in TCGA GBM patient samples divided into high and low miR-124 / miR-210 levels. (c) Schematic of Laser-Capture Microdissection. Top: region of pseudopalisading necrosis. The inner necrotic region is discarded, while the pseudopalisade is collected as “hypoxic tissue”. Bottom: Non-necrotic region, collected as the perfused (“normoxic”) tissue counterpart. (d) miR-124 and GLUT1 mRNA levels in perfused or “normoxic” and hypoxic regions in patient samples. Top: averages; bottom: paired representation (each pair is from an individual patient). * p - value = 0.047 (miR-124 changes); p - value = 0.035 (GLUT1 changes). n = 4 patients.