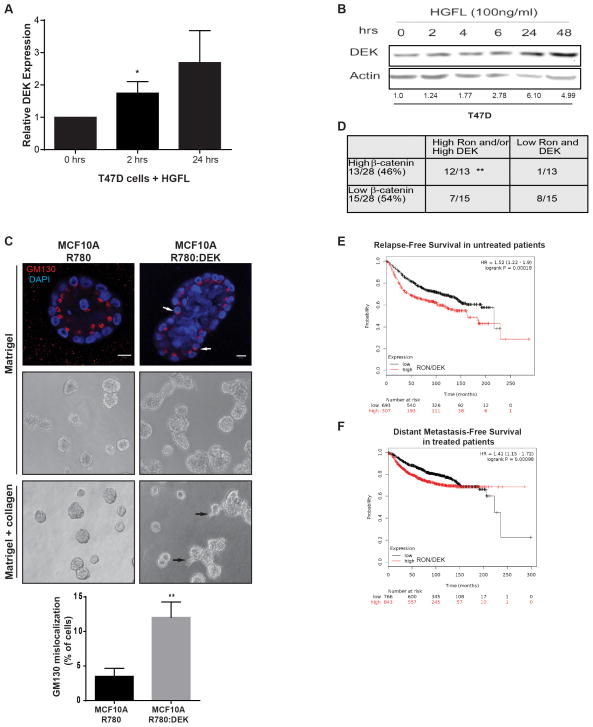
Figure 6. Ron and DEK cooperate in human breast cancer to promote disease progression.
(A) DEK is a down-stream target gene of activated Ron signaling in T47D human breast cancer cells. T47D cells were treated with HGFL to activate Ron signaling and DEK expression was analyzed by quantitative RT-PCR. Expression was compared to GAPDH and normalized to expression in untreated cells. For the 24 hour time point, p=0.07 and significance was calculated with a one-tailed unpaired t-test. (B) DEK protein levels are elevated following HGFL-mediated activation of Ron signaling. T47D cells were treated with HGFL for the time periods shown and whole cell lysates were analyzed by western blotting. (C) DEK over-expression in MCF10A cells induces phenotypes of advanced breast cancer in 3D culture, including increased acinar size, cells present within the lumen, and cellular invasion. MCF10A cells transduced with R780 or R780:DEK (human DEK) were grown in Matrigel 3D culture (top and middle panels) to test for morphology or Matrigel-collagen 3D cultures to test for invasion (bottom panel). Immunofluorescence was performed on day 20 of culture and visualized with a Zeiss LSM510 scanning confocal microscope; the white size bar represents 10μm. Phase contrast images are also shown in the middle and bottom panels, and black arrows indicate invading cells in the bottom panel. The Golgi marker GM130 is used to mark cell apical-basal polarity, and white arrows highlight cells with de-regulated polarity. The percentage of cells with mislocalized GM130 per acinar structure is depicted below the images, which was calculated from triplicate experiments. (D) DEK and RON expression predict β-catenin expression levels in primary human breast cancer. Serial sections from two tissue microarrays of patient-derived breast infiltrating ductal carcinomas were stained by immunohistochemistry for DEK, RON, and β-catenin expression. Correlation was analyzed by χ2 testing. (E and F) Combined DEK and RON expression predict disease relapse in a cohort of 1000 un-medicated patients (p=0.00018) (E) and progression to distant metastatic disease in 1609 patients treated with systemic therapies (p=0.00098) (F). A meta-analysis of patient and gene expression data archived in Kaplan-Meier Plotter (www.kmplot.com) was performed to generate Kaplan-Meier curves. The numbers under each graph represent the number of patients at each time point.

