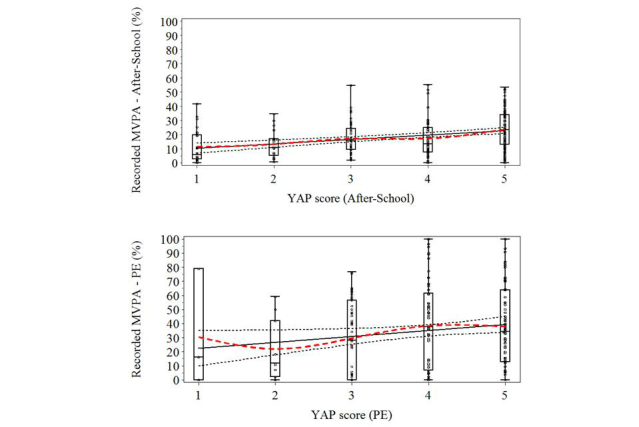
Figure 5.

Relation between percent time in moderate-to-vigorous physical activity (MVPA) measured by the SenseWear Armband accelerometer and YAP raw scores during physical education (PE; bottom) and during after-school time (top) (n=221 participants from grades 4 to 12). The solid black line represents the line of best fit with respective 95% confidence intervals; the dashed red line fits a smooth curve across the distribution of scores. The lack of overlap between these suggests a nonlinear trend relation between percent time in MVPA and YAP scores.
