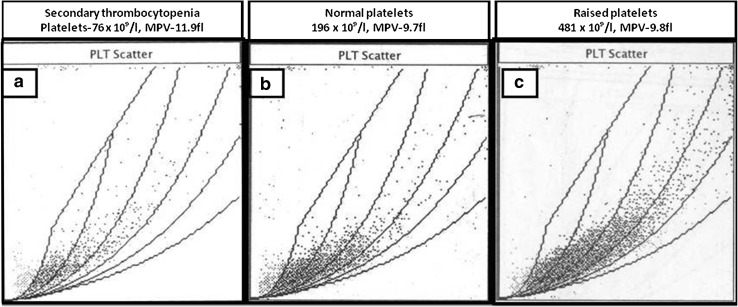
Fig. 2.
The platelet cytogram in patients with normal (b) or high platelet counts (c) which shows a density pattern in the normal sized scatter zone signifying normal platelet volumes in majority of platelets for a particular sample. The same pattern is also maintained in patients with acquired (secondary) thrombocytopenia (a)

