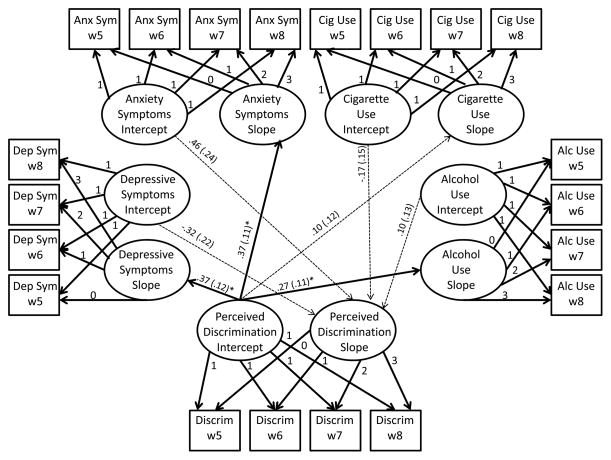
Figure 1.
Parallel process latent growth model of perceived discrimination and mental health and substance use.
Note. Model includes standardized coefficients and standard errors in parentheses. Not shown in the figure include paths from gender, family SES, and highest grade completed at wave 5 to all intercept and slope factors. In addition, correlations among exogenous variables, intercepts, corresponding intercept and slope factors, and disturbances of slope factors are not included in the figure but are reported in Table 4 (online supplement). Solid lines represent significant paths and dashed lines represent non-significant paths. *p < .05

