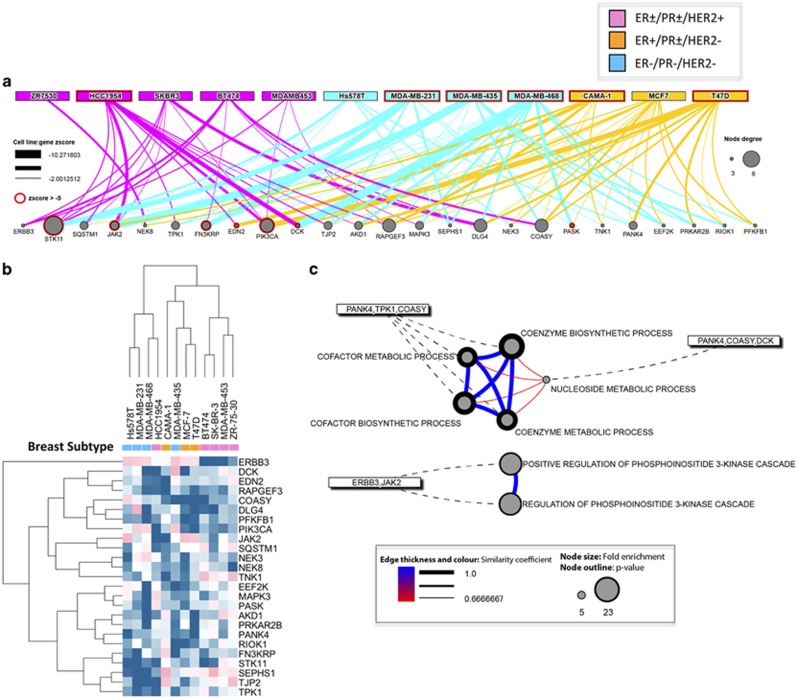
Figure 2.
Comprehensive kinase screen. (a) Network interaction diagram of the top siRNAs that decreased proliferation across cell lines (comprehensive screen). Hits common to normal breast cell lines (MCF10A and MCF12A) not shown. Node size is proportional to number of cell lines in which a given node was a hit. Edges are color coded by breast cancer subtype (pink, ER±/PR±/HER2+ blue, ER−/PR−/HER2− orange, ER+/PR±/HER2−). Edge thickness represents intensity of proliferation decrease (Z-score). (b) Heatmap of siRNA from (a) that inhibit proliferation of breast cancer cell lines. (c) GO and pathway enrichment analysis (DAVID) of siRNA-targeted genes that decreased breast cancer cell line proliferation in the comprehensive screen. Circular nodes describe the class term examined for enrichment, with the size of the node scaled by the fold enrichment for the class term across the siRNA library screened. The thickness of the node outline represents P-value.

