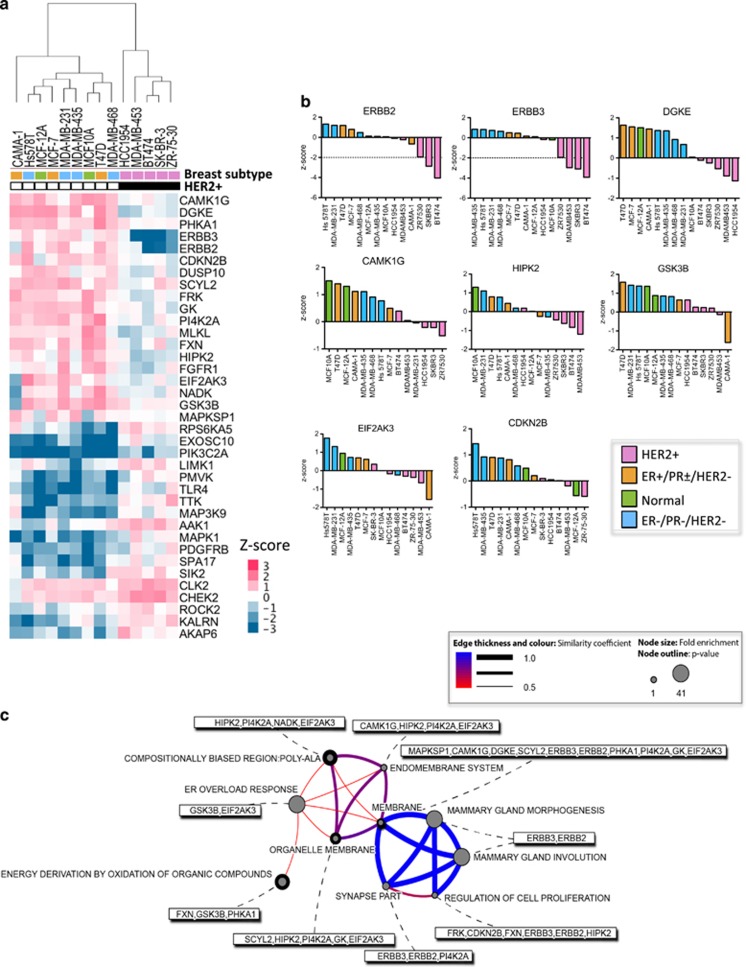
Figure 3.
Identification of kinases whose inhibition preferentially blocks the proliferation of HER2+ breast cancer cell lines. (a) Heatmap of unbiased selection of siRNAs that differ in their effects on HER2+ and non-HER2-amplified breast cancer cell lines (comprehensive screen). CMS based on HER2 status was performed using Gene Pattern software. Only statistically significant effects are shown (P<0.01, permutation test, median T-test). Supervised hierarchical clustering analysis of siRNAs and cell lines was performed using Cluster 3.0 software (Michael Eisen). Data were visualized using Java TreeView. (b) Waterfall plots of the indicated kinases from (a) whose siRNA-mediated inhibition selectively blocked the proliferation of HER2+ cell lines (pink bars). (c) Gene enrichment analysis (DAVID) of siRNA-targeted genes identified in a. Analysis was performed as for Figure 2c.

